Redbox 2005 Annual Report Download - page 50
Download and view the complete annual report
Please find page 50 of the 2005 Redbox annual report below. You can navigate through the pages in the report by either clicking on the pages listed below, or by using the keyword search tool below to find specific information within the annual report.-
 1
1 -
2
-
3
-
4
-
5
-
6
-
7
-
8
-
9
-
10
-
11
-
12
-
13
-
14
-
15
-
16
-
17
-
18
-
19
-
20
-
21
-
22
-
23
-
24
-
25
-
26
-
27
-
28
-
29
-
30
-
31
-
32
-
33
-
34
-
35
-
36
-
37
-
38
-
39
-
 40
40 -
 41
41 -
 42
42 -
 43
43 -
 44
44 -
 45
45 -
 46
46 -
 47
47 -
 48
48 -
 49
49 -
 50
50 -
 51
51 -
 52
52 -
 53
53 -
 54
54 -
 55
55 -
 56
56 -
 57
57 -
 58
58 -
 59
59 -
 60
60 -
61
-
62
-
63
-
64
-
65
-
66
-
67
-
68
 |
 |

COINSTAR, INC.
NOTES TO CONSOLIDATED FINANCIAL STATEMENTS—(Continued)
YEARS ENDED DECEMBER 31, 2005, 2004, AND 2003
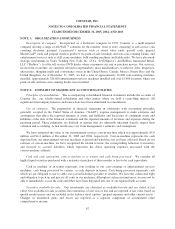
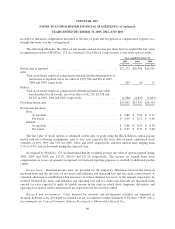
recorded as unearned compensation measured at the date of grant and recognized as compensation expense on a
straight-line basis over the vesting period.
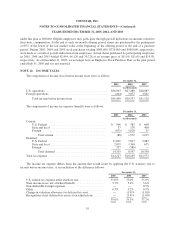
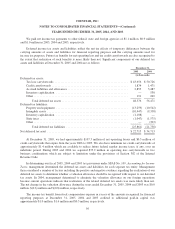
The following illustrates the effect on net income and net income per share had we applied the fair value
recognition provision of SFAS No. 123, Accounting for Stock-Based Compensation, to the stock option awards.
Year ended December 31,
2005 2004 2003
(in thousands, except per share data)
Net income as reported: .............................................. $22,272 $20,368 $19,555
Add:
Total stock-based employee compensation included in the determination of
net income as reported, net of tax effect of $133, $26 and $10 in 2005,
2004 and 2003, respectively ..................................... 207 50 17
Deduct:
Total stock-based employee compensation determined under fair value
based method for all awards, net of tax effect of $2,259, $2,558 and
$2,313 in 2005, 2004 and 2003, respectively ........................ (4,588) (4,827) (5,053)
Pro forma net income: ............................................... $17,891 $15,591 $14,519
Net income per share:
Basic:
As reported ................................................ $ 0.86 $ 0.94 $ 0.91
Pro forma ................................................. $ 0.69 $ 0.72 $ 0.68
Diluted:
As reported ................................................ $ 0.86 $ 0.93 $ 0.90
Pro forma ................................................. $ 0.69 $ 0.72 $ 0.68
The fair value of stock options is estimated on the date of grant using the Black-Scholes option-pricing
model with the following assumptions: four to five year expected life from date of grant; annualized stock
volatility of 49%, 69% and 72% for 2005, 2004, and 2003, respectively; risk-free interest rates ranging from
2.7% to 4.4%; and no dividends during the expected term.
As required by SFAS No. 123, we determined that the weighted average fair value of options granted during
2005, 2004 and 2003 was $11.07, $10.99 and $11.10, respectively. The income tax benefit from stock
compensation in excess of amounts recognized for financial reporting purposes is credited to additional paid-in
capital.
Income taxes: Deferred income taxes are provided for the temporary differences between the financial
reporting basis and the tax basis of our assets and liabilities and operating loss and tax credit carryforwards. A
valuation allowance is established when necessary to reduce deferred tax assets to the amount expected to be
realized. Deferred tax assets and liabilities and operating loss and tax credit carryforwards are measured using
enacted tax rates expected to apply to taxable income in the years in which those temporary differences and
operating loss and tax credit carryforwards are expected to be recovered or settled.
Research and development: Costs incurred for research and development activities are expensed as
incurred. Software costs developed for internal use are accounted for under Statement of Position (“SOP”) 98-1,
Accounting for the Costs of Computer Software Developed or Obtained for Internal Use.
46