Redbox 2005 Annual Report Download - page 26
Download and view the complete annual report
Please find page 26 of the 2005 Redbox annual report below. You can navigate through the pages in the report by either clicking on the pages listed below, or by using the keyword search tool below to find specific information within the annual report.-
 1
1 -
2
-
3
-
4
-
5
-
6
-
7
-
8
-
9
-
10
-
11
-
12
-
13
-
14
-
15
-
 16
16 -
 17
17 -
 18
18 -
 19
19 -
 20
20 -
 21
21 -
 22
22 -
 23
23 -
 24
24 -
 25
25 -
 26
26 -
 27
27 -
 28
28 -
 29
29 -
 30
30 -
 31
31 -
 32
32 -
 33
33 -
 34
34 -
 35
35 -
 36
36 -
37
-
38
-
39
-
40
-
41
-
42
-
43
-
44
-
45
-
46
-
47
-
48
-
49
-
50
-
51
-
52
-
53
-
54
-
55
-
56
-
57
-
58
-
59
-
60
-
61
-
62
-
63
-
64
-
65
-
66
-
67
-
68
 |
 |
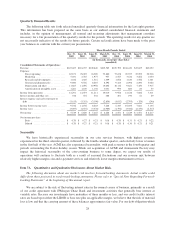
and (3) field operations support and related expenses. Variations in the percentage of transaction fees we
pay to our retail partners may result in increased expenses. Such variations are based on our evaluation of
certain factors with the retailer, such as total revenue, e-payment capabilities, long-term non-cancelable
contracts, installation of our machines in high traffic and/or urban or rural locations, new product
commitments, or other criteria.
For entertainment services, these expenses consist primarily of (1) the fees we pay our retail partners as
commissions and for the placement of machines, (2) the cost of plush toys and other products dispensed
from the skill-crane and bulk-vending machines and (3) field operations support and related expenses.
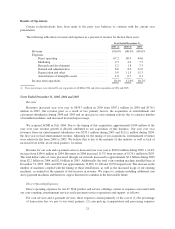
Direct operating expenses increased to $309.2 million during the year ended December 31, 2005 from
$186.9 million during 2004 and $78.6 million during 2003. Direct operating expenses increased primarily due to
expenses incurred to support our increased year over year revenues and the acquisitions of our entertainment
businesses. The addition of our entertainment companies to our 4th Wall products and services offerings has
added inventory and related freight cost to our direct operating expenses, which we do not incur operating our
coin-counting services. Direct operating expenses as a percentage of revenue increased year over year to 67.2%
during 2005, from 60.9% during 2004 and 44.6% during 2003, mainly from the addition of our entertainment
subsidiaries which represented about 52% of our total revenue during 2005. This increase is mainly due to our
entertainment business which has higher ongoing direct operating costs as a percentage of revenue than our coin
business. We are in the process of integrating our various business operations and expect to realize some
operating expense efficiencies as a percentage of revenue during 2006.
Marketing
Our marketing expenses consist primarily of marketing, advertising and public relations efforts in existing
market regions and startup marketing expenses incurred to launch our services in new regional markets.
Marketing expenses decreased to $10.7 million during the year ended December 31, 2005 from $12.9
million during 2004 and $13.2 million during 2003. We have been directing most of our advertising dollars
toward regional broadcasting and promotions as we introduce e-payment features on our coin-counting machines
and other e-payment product channels like our gift card mall offerings. Our regional introduction of e-payment
products enables us to use cost effective regional marketing strategies rather than more expensive national
marketing campaigns. This directed marketing and advertising approach continues driving increased trial and
repeat usage of both our coin services offering and e-payment products. Since our revenues have significantly
increased primarily due to our acquisition of ACMI in 2004, and our marketing expenditures have decreased,
marketing as a percentage of revenue decreased to 2.3% from 4.2% during 2004 and 7.5% during 2003.
Research and Development
Our research and development expenses consist primarily of development costs of our coin-counting
machine software, network applications, machine improvements and new product development.
Research and development expenses have remained relatively consistent. Our research and development
expenses were $5.7 million during the year ended December 31, 2005, $5.5 million during 2004 and $5.8 million
during 2003. Research and development expenses represent expenditures to support development and design of
complementary new product ideas and continue our ongoing efforts to enhance our existing products and
services, primarily our coin-counting system. It is our intent to continue to invest in research and development in
the coming years. Over the last two years we have also acquired some technology related to our entertainment
business. We have capitalized these costs as intangible assets. Since revenues have increased significantly and
our research and development expenditures remained relatively consistent, research and development as a
percentage of revenue has been decreasing to 1.2% during 2005 from 1.8% during 2004 and 3.3% during 2003.
22