Redbox 2005 Annual Report Download - page 25
Download and view the complete annual report
Please find page 25 of the 2005 Redbox annual report below. You can navigate through the pages in the report by either clicking on the pages listed below, or by using the keyword search tool below to find specific information within the annual report.-
 1
1 -
2
-
3
-
4
-
5
-
6
-
7
-
8
-
9
-
10
-
11
-
12
-
13
-
14
-
 15
15 -
 16
16 -
 17
17 -
 18
18 -
 19
19 -
 20
20 -
 21
21 -
 22
22 -
 23
23 -
 24
24 -
 25
25 -
 26
26 -
 27
27 -
 28
28 -
 29
29 -
 30
30 -
 31
31 -
 32
32 -
 33
33 -
 34
34 -
 35
35 -
36
-
37
-
38
-
39
-
40
-
41
-
42
-
43
-
44
-
45
-
46
-
47
-
48
-
49
-
50
-
51
-
52
-
53
-
54
-
55
-
56
-
57
-
58
-
59
-
60
-
61
-
62
-
63
-
64
-
65
-
66
-
67
-
68
 |
 |

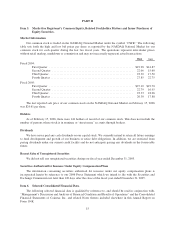
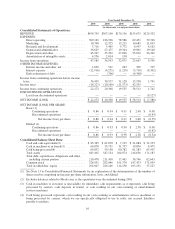
Results of Operations
Certain reclassifications have been made to the prior year balances to conform with the current year
presentation.
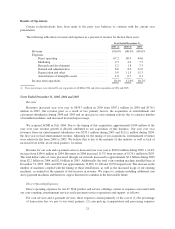
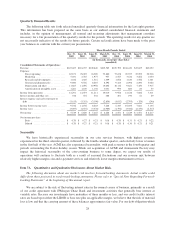
The following table shows revenue and expenses as a percent of revenue for the last three years:
Year Ended December 31,
2005 (1) 2004 (1) 2003
Revenue ........................................... 100.0% 100.0% 100.0%
Expenses:
Direct operating ................................. 67.2 60.9 44.6
Marketing ...................................... 2.3 4.2 7.5
Research and development ......................... 1.2 1.8 3.3
General and administrative ......................... 8.0 8.9 11.0
Depreciation and other ............................ 9.9 11.5 15.3
Amortization of intangible assets .................... 1.0 0.7 0.1
Income from operations ............................... 10.4% 12.0% 18.2%
(1) These percentages were affected by our acquisition of ACMI in 2004 and other acquisitions in 2004 and 2005.
Years Ended December 31, 2005, 2004 and 2003
Revenue
Revenues increased year over year to $459.7 million in 2005 from $307.1 million in 2004 and $176.1
million in 2003. Our revenue grew as a result of two primary factors, the acquisition of entertainment and
e-payment subsidiaries during 2004 and 2005 and an increase in coin-counting activity due to a greater number
of installed machines, and increased trial and repeat usage.
We acquired ACMI in July 2004. Due to the timing of this acquisition, approximately $100 million of the
year over year revenue growth is directly attributed to our acquisition of this business. Our year over year
revenues from our entertainment subsidiaries was $239.1 million during 2005 and $111.1 million during 2004,
the first year we had entertainment revenue. Adjusting for the timing of our acquisitions, entertainment revenues
were relatively flat from 2004 to 2005. We believe this is due to the maturity of this industry as well as lack of
increased foot traffic at our retail partners’ locations.
Revenue for our coin and e-payment services increased year over year to $220.6 million during 2005, a 12.6%
increase from $196.0 million in 2004. Revenues in 2004 increased 11.3% from revenues of $176.1 million in 2003.
The total dollar value of coins processed through our network increased to approximately $2.3 billion during 2005
from $2.2 billion in 2004 and $2.0 billion in 2003. Additionally, the total coin-counting machine installed base at
December 31, 2005, 2004 and 2003 was approximately 12,800, 12,100 and 10,700 respectively. The increase in the
number of machines coupled with the timing of those installations, as well as the increased usage of our existing
machines, accounted for the majority of this increase in revenue. We expect to continue installing additional coin
and e-payment machines and therefore, expect this trend to continue in the foreseeable future.
Direct Operating Expenses
Direct operating expenses for our 4th Wall product and service offerings consist of expenses associated with
our coin-counting, entertainment services and e-payment services operations and support, as follows:
For coin services and e-payment services, these expenses consist primarily of the cost of (1) the percentage
of transaction fees we pay to our retail partners, (2) coin pick-up, transportation and processing expenses
21