Redbox 2005 Annual Report Download - page 27
Download and view the complete annual report
Please find page 27 of the 2005 Redbox annual report below. You can navigate through the pages in the report by either clicking on the pages listed below, or by using the keyword search tool below to find specific information within the annual report.-
 1
1 -
2
-
3
-
4
-
5
-
6
-
7
-
8
-
9
-
10
-
11
-
12
-
13
-
14
-
15
-
16
-
 17
17 -
 18
18 -
 19
19 -
 20
20 -
 21
21 -
 22
22 -
 23
23 -
 24
24 -
 25
25 -
 26
26 -
 27
27 -
 28
28 -
 29
29 -
 30
30 -
 31
31 -
 32
32 -
 33
33 -
 34
34 -
 35
35 -
 36
36 -
 37
37 -
38
-
39
-
40
-
41
-
42
-
43
-
44
-
45
-
46
-
47
-
48
-
49
-
50
-
51
-
52
-
53
-
54
-
55
-
56
-
57
-
58
-
59
-
60
-
61
-
62
-
63
-
64
-
65
-
66
-
67
-
68
 |
 |
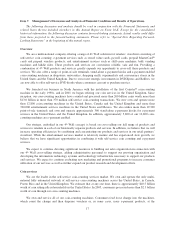
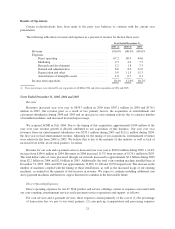
General and Administrative
Our general and administrative expenses consist primarily of administrative support for field operations,
customer service, systems and engineering support, computer network operations, finance, human resources,
occupancy expenses, legal expenses and insurance.
General and administrative expenses increased to $36.6 million during the year ended December 31, 2005,
from $27.5 million during 2004 and $19.3 million during 2003. We attribute the year over year increases to our
acquisition of entertainment subsidiary companies over the last two years and the related costs of providing
administrative support to our subsidiary businesses. Our increased general and administrative expenditures represent
the incremental cost of supporting subsidiary companies with regional offices throughout the United States. These
costs include, among others, the expenditures incurred for consulting fees relating to Sarbanes-Oxley and our
internal compliance costs, including documentation and testing. Our Sarbanes-Oxley 404 internal control
compliance costs totaled approximately $2.0 million in 2005 and $1.5 million in 2004. In 2003 we incurred an
insignificant amount of compliance expenses, mainly internal costs to plan and document our internal control
compliance strategy. General and administrative expense as a percentage of revenue has decreased to 8.0% during
2005 from 8.9% during 2004 and 11.0% during 2003. This is due to efficiency realized from integrating some of
our administrative processes and support across our subsidiary companies. For the forseeable future, we will
continue to strive for additional synergies as a result of efficiencies gained from our integrations.
Depreciation and Other
Our depreciation and other expenses consist primarily of depreciation charges on our installed coin-counting
and entertainment services machines and depreciation on computer equipment and leased automobiles.
Depreciation and other expense increased to $45.3 million during the year ended December 31, 2005, from
$35.3 million during 2004 and $27.0 during 2003. Depreciation expense increased each year primarily due to our
increased installed entertainment machine counts from the acquisitions of our subsidiary companies.
Depreciation and other expense as a percentage of revenue decreased to 9.9% during 2005 from 11.5% during
2004 and 15.3% during 2003.
Amortization of Intangible Assets
Our amortization expense consists of amortization of intangible assets including retailer relationships that
were valued in connection with our acquisitions.
Amortization of intangible assets increased to $4.6 million during the year ended December 31, 2005, from
$2.0 million during 2004 and $0.1 million during 2003. Amortization expense of intangible assets increased due
to our acquisitions of subsidiary companies in 2005 and 2004. Our intangible assets are mainly composed of the
value assigned to acquired retailer relationships and to a lesser extent acquired internally developed software
from acquisitions of our subsidiary companies. Amortization expense as a percentage of revenue increased to
1.0% during 2005 from 0.7% during 2004 and 0.1% during 2003.
Other Income and Expense
Interest income and other, net, increased to $1.8 million during the year ended December 31, 2005, from
$0.5 million during 2004 and $0.3 million during 2003. The increase in interest and other income is mainly due
to an increase of interest earned on investments due to increased interest rates throughout the year and higher
average investment balances, as well as net income from equity investments.
Interest expense increased to $12.9 million during the year ended December 31, 2005 from $6.3 million
during 2004 and $1.2 million during 2003. The increase is due to the full year recognition of interest expense
23