Redbox 2005 Annual Report Download - page 32
Download and view the complete annual report
Please find page 32 of the 2005 Redbox annual report below. You can navigate through the pages in the report by either clicking on the pages listed below, or by using the keyword search tool below to find specific information within the annual report.-
 1
1 -
2
-
3
-
4
-
5
-
6
-
7
-
8
-
9
-
10
-
11
-
12
-
13
-
14
-
15
-
16
-
17
-
18
-
19
-
20
-
21
-
 22
22 -
 23
23 -
 24
24 -
 25
25 -
 26
26 -
 27
27 -
 28
28 -
 29
29 -
 30
30 -
 31
31 -
 32
32 -
 33
33 -
 34
34 -
 35
35 -
 36
36 -
 37
37 -
 38
38 -
 39
39 -
 40
40 -
 41
41 -
 42
42 -
43
-
44
-
45
-
46
-
47
-
48
-
49
-
50
-
51
-
52
-
53
-
54
-
55
-
56
-
57
-
58
-
59
-
60
-
61
-
62
-
63
-
64
-
65
-
66
-
67
-
68
 |
 |

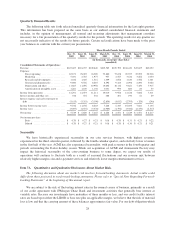
Quarterly Financial Results
The following table sets forth selected unaudited quarterly financial information for the last eight quarters.
This information has been prepared on the same basis as our audited consolidated financial statements and
includes, in the opinion of management, all normal and recurring adjustments that management considers
necessary for a fair presentation of the quarterly results for the periods. The operating results for any quarter are
not necessarily indicative of the results for future periods. Certain reclassifications have been made to the prior
year balances to conform with the current year presentation.
Three Month Periods Ended
Dec. 31,
2005
Sept. 30,
2005
June 30,
2005
March 31,
2005
Dec. 31,
2004
Sept. 30,
2004
June 30,
2004
March 31,
2004
(in thousands, except per share data)
(unaudited)
Consolidated Statements of Operations:
Revenue .............................. $125,607 $118,707 $109,840 $105,585 $109,793 $106,430 $47,825 $43,052
Expenses:
Direct operating .................... 83,871 78,022 74,389 72,880 73,678 69,937 23,093 20,218
Marketing ......................... 5,031 2,785 1,975 957 4,567 3,642 3,666 1,050
Research and development ............ 1,446 1,445 1,516 1,309 1,058 1,410 1,556 1,441
General and administrative ............ 9,800 9,546 8,687 8,592 9,423 8,098 4,890 5,064
Depreciation and other ............... 11,887 11,696 10,958 10,806 10,116 9,821 7,450 7,915
Amortization of intangible assets ....... 1,281 1,140 1,104 1,031 993 884 84 53
Income from operations .................. 12,291 14,073 11,211 10,010 9,958 12,638 7,086 7,311
Interest income and other, net .............. 338 472 532 488 201 190 61 69
Interest expense and early retirement of
debt ................................ (3,613) (3,353) (3,100) (2,850) (3,812) (2,793) (126) (246)
Income before income taxes ............... 9,016 11,192 8,643 7,648 6,347 10,035 7,021 7,134
Income taxes ........................... (3,497) (4,372) (3,378) (2,980) (1,796) (3,386) (2,470) (2,517)
Net income ............................ $ 5,519 $ 6,820 $ 5,265 $ 4,668 $ 4,551 $ 6,649 $ 4,551 $ 4,617
Net income per share:
Basic ............................. $ 0.20 $ 0.27 $ 0.21 $ 0.18 $ 0.20 $ 0.31 $ 0.21 $ 0.22
Diluted ........................... $ 0.20 $ 0.27 $ 0.21 $ 0.18 $ 0.20 $ 0.30 $ 0.21 $ 0.21
Seasonality
We have historically experienced seasonality in our coin services business, with highest revenues
experienced in the third calendar quarter, followed by the fourth calendar quarter, and relatively lower revenues
in the first half of the year. ACMI has also experienced seasonality, with peak revenues in the fourth quarter and
periods surrounding the Easter holiday season. While our acquisition of ACMI and Amusement Factory may
impact the historical seasonality of the coin-counting business to some degree, we expect our results of
operations will continue to fluctuate both as a result of seasonal fluctuations and our revenue mix between
relatively higher margin coin and e-payment services and relatively lower margin entertainment services.
Item 7A. Quantitative and Qualitative Disclosures About Market Risk.
The following discussion about our market risk involves forward-looking statements. Actual results could
differ from those projected in our forward-looking statements. Please refer to “Special Note Regarding Forward-
Looking Statements” at the beginning of this annual report.
We are subject to the risk of fluctuating interest rates in the normal course of business, primarily as a result
of our credit agreement with JPMorgan Chase Bank and investment activities that generally bear interest at
variable rates. Because our investments have maturities of three months or less, and our credit facility interest
rates are based upon either the LIBOR or base rate plus an applicable margin, we believe that the risk of material
loss is low and that the carrying amount of these balances approximates fair value. For our debt obligation which
28