Qantas 2009 Annual Report Download - page 90
Download and view the complete annual report
Please find page 90 of the 2009 Qantas annual report below. You can navigate through the pages in the report by either clicking on the pages listed below, or by using the keyword search tool below to find specific information within the annual report.-
 1
1 -
2
-
3
-
4
-
5
-
6
-
7
-
8
-
9
-
10
-
11
-
12
-
13
-
14
-
15
-
16
-
17
-
18
-
19
-
20
-
21
-
22
-
23
-
24
-
25
-
26
-
27
-
28
-
29
-
30
-
31
-
32
-
33
-
34
-
35
-
36
-
37
-
38
-
39
-
40
-
41
-
42
-
43
-
44
-
45
-
46
-
47
-
48
-
49
-
50
-
51
-
52
-
53
-
54
-
55
-
56
-
57
-
58
-
59
-
60
-
61
-
62
-
63
-
64
-
65
-
66
-
67
-
68
-
69
-
70
-
71
-
72
-
73
-
74
-
75
-
76
-
77
-
78
-
79
-
 80
80 -
 81
81 -
 82
82 -
 83
83 -
 84
84 -
 85
85 -
 86
86 -
 87
87 -
 88
88 -
 89
89 -
 90
90 -
 91
91 -
 92
92 -
 93
93 -
 94
94 -
 95
95 -
 96
96 -
 97
97 -
 98
98 -
 99
99 -
 100
100 -
101
-
102
-
103
-
104
-
105
-
106
-
107
-
108
-
109
-
110
-
111
-
112
-
113
-
114
-
115
-
116
-
117
-
118
-
119
-
120
-
121
-
122
-
123
-
124
-
125
-
126
-
127
-
128
-
129
-
130
-
131
-
132
-
133
-
134
-
135
-
136
-
137
-
138
-
139
-
140
-
141
-
142
-
143
-
144
-
145
-
146
-
147
-
148
-
149
-
150
-
151
-
152
-
153
-
154
-
155
-
156
-
157
-
158
-
159
-
160
-
161
-
162
-
163
-
164
 |
 |
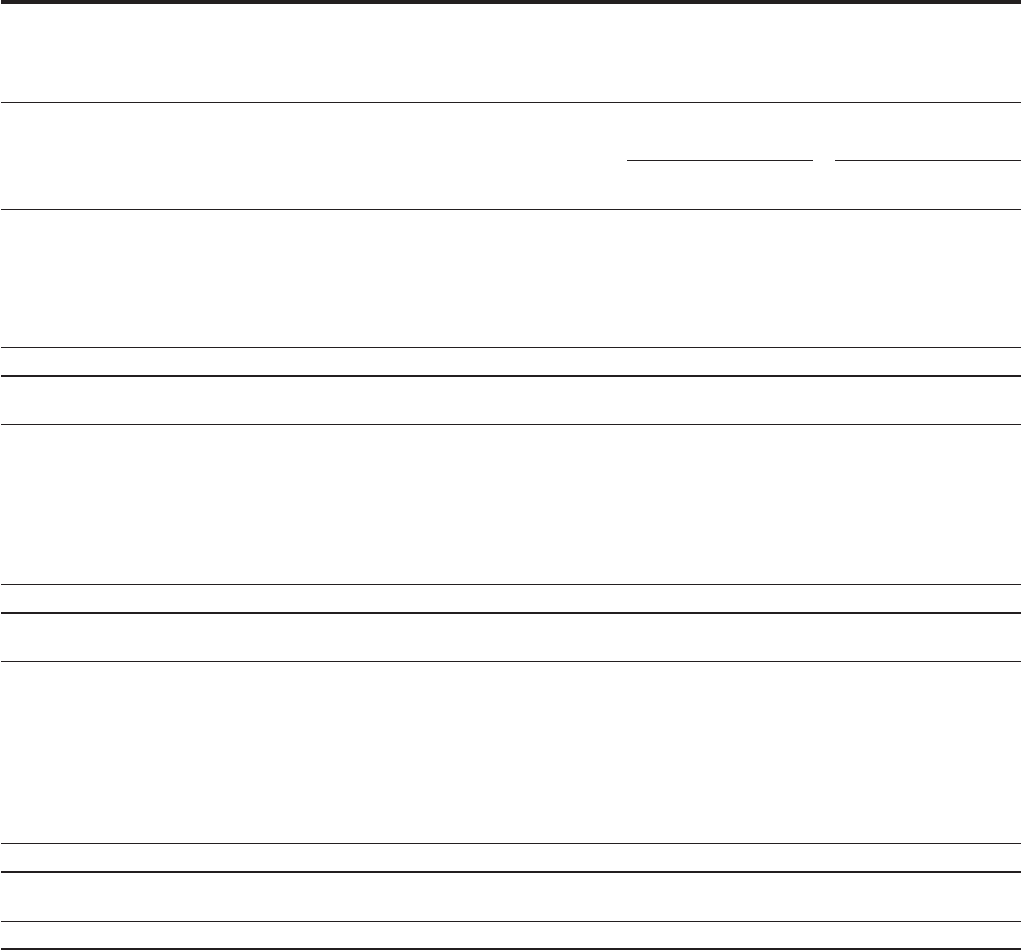
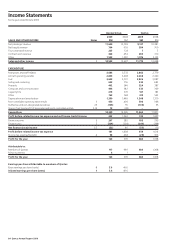
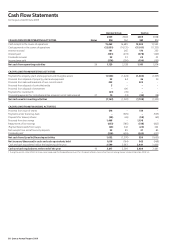
88 Qantas Annual Report 2009
Cash Flow Statements
for the year ended 30 June 2009
Qantas Group Qantas
2009 2008 2009 2008
CASH FLOWS FROM OPER ATING AC TIVITIES Notes $M $M $M $M
Cash receipts in the course of operations 15,462 16,685 12,530 13,552
Cash payments in the course of operations (13,891) (14,135) (11,011) (11,333)
Interest received 191 265 170 235
Interest paid (381) (419) (378) (349)
Dividends received 22 22 20 22
Income taxes paid (274) (290) (190) (153)
Net cash from operating activities 26 1,129 2,128 1,141 1,974
CASH FLOWS FROM INVESTING ACTIVITIES
Payments for property, plant and equipment and intangible assets (1,530) (1,424) (1,434) (1,325)
Proceeds from disposal of property, plant and equipment 52 44 26 20
Proceeds from sale and leaseback of non-current assets 323 – 323 –
Proceeds from disposal of controlled entity 5 – – –
Proceeds from disposal of investment – 106 – –
Payments for investments (23) (35) – –
Proceeds/(payments) for controlled entities acquired, net of cash acquired 27 10 (13) (23) (28)
Net cash used in investing activities (1,163) (1,322) (1,108) (1,333)
CASH FLOWS FROM FINANCING ACTIVITIES
Proceeds from issue of shares 514 – 514 –
Payments under share buy-back – (505) – (505)
Payments for treasury shares (58) (69) (58) (69)
Proceeds from borrowings 1,468 – 1,198 –
Repayments of borrowings (653) (785) (518) (825)
(Payments)/proceeds from swaps (24) 342 (24) 342
Net receipts from aircraft security deposits 23 85 21 85
Dividends paid1 (218) (638) (203) (637)
Net cash from/(used in) financing activities 1,052 (1,570) 930 (1,609)
Net increase/(decrease) in cash and cash equivalents held 1,018 (764) 963 (968)
Cash and cash equivalents held at the beginning of the year 2,599 3,363 2,441 3,409
Cash and cash equivalents at the end of the year 10 3,617 2,599 3,404 2,441
1. During the year, 83 million (2008: nil) shares were issued under the Dividend Reinvestment Plan. Dividends settled in shares rather than cash during the year totalled $236 million (2008: nil).