Qantas 2009 Annual Report Download - page 80
Download and view the complete annual report
Please find page 80 of the 2009 Qantas annual report below. You can navigate through the pages in the report by either clicking on the pages listed below, or by using the keyword search tool below to find specific information within the annual report.-
 1
1 -
2
-
3
-
4
-
5
-
6
-
7
-
8
-
9
-
10
-
11
-
12
-
13
-
14
-
15
-
16
-
17
-
18
-
19
-
20
-
21
-
22
-
23
-
24
-
25
-
26
-
27
-
28
-
29
-
30
-
31
-
32
-
33
-
34
-
35
-
36
-
37
-
38
-
39
-
40
-
41
-
42
-
43
-
44
-
45
-
46
-
47
-
48
-
49
-
50
-
51
-
52
-
53
-
54
-
55
-
56
-
57
-
58
-
59
-
60
-
61
-
62
-
63
-
64
-
65
-
66
-
67
-
68
-
69
-
 70
70 -
 71
71 -
 72
72 -
 73
73 -
 74
74 -
 75
75 -
 76
76 -
 77
77 -
 78
78 -
 79
79 -
 80
80 -
 81
81 -
 82
82 -
 83
83 -
 84
84 -
 85
85 -
 86
86 -
 87
87 -
 88
88 -
 89
89 -
 90
90 -
91
-
92
-
93
-
94
-
95
-
96
-
97
-
98
-
99
-
100
-
101
-
102
-
103
-
104
-
105
-
106
-
107
-
108
-
109
-
110
-
111
-
112
-
113
-
114
-
115
-
116
-
117
-
118
-
119
-
120
-
121
-
122
-
123
-
124
-
125
-
126
-
127
-
128
-
129
-
130
-
131
-
132
-
133
-
134
-
135
-
136
-
137
-
138
-
139
-
140
-
141
-
142
-
143
-
144
-
145
-
146
-
147
-
148
-
149
-
150
-
151
-
152
-
153
-
154
-
155
-
156
-
157
-
158
-
159
-
160
-
161
-
162
-
163
-
164
 |
 |
78 Qantas Annual Report 2009
Directors’ Report
for the year ended 30 June 2009
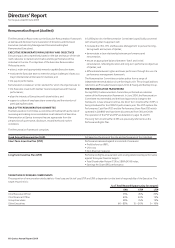
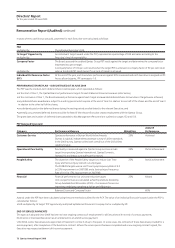
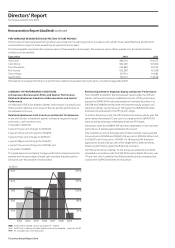
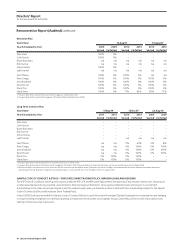
PERFORMANCE REMUNERATION AFFECTING FUTURE PERIODS
The fair value of share-based payments granted is amortised over the vesting period (in accordance with AASB 2 Share-based Payment) and therefore
remuneration in respect of these awards may be reported in future years.
The following table summarises the maximum value of these awards in future years. The minimum value of these awards is nil, should performance
conditions not be satisfied.
Executives 2010 2011
Alan Joyce 989,310 314,572
Colin Storrie 502,041 107,360
Bruce Buchanan 199,682 90,236
Rob Gurney 163,380 62,428
Simon Hickey 397,591 91,682
Lyell Strambi 190,341 114,638
Information on vesting and forfeiture of performance related remuneration during the year is provided on pages 80 and 81.
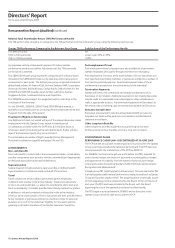
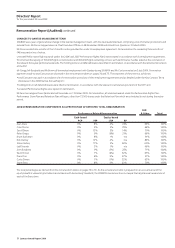
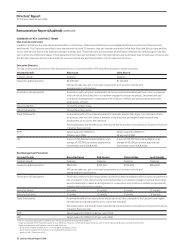
SUMMARY OF PERFORMANCE CONDITIONS
Link between Remuneration Policy and Qantas’ Performance
Relationship between Fixed Annual Remuneration and Qantas’
Performance
An individual’s FAR is not related to Qantas’ performance in a specific year.
FAR is set with reference to the scope of the role and the performance of
the individual in the role.
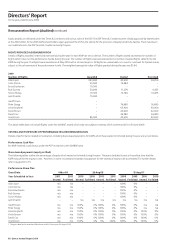
Relationship between Cash Incentives and Qantas’ Performance
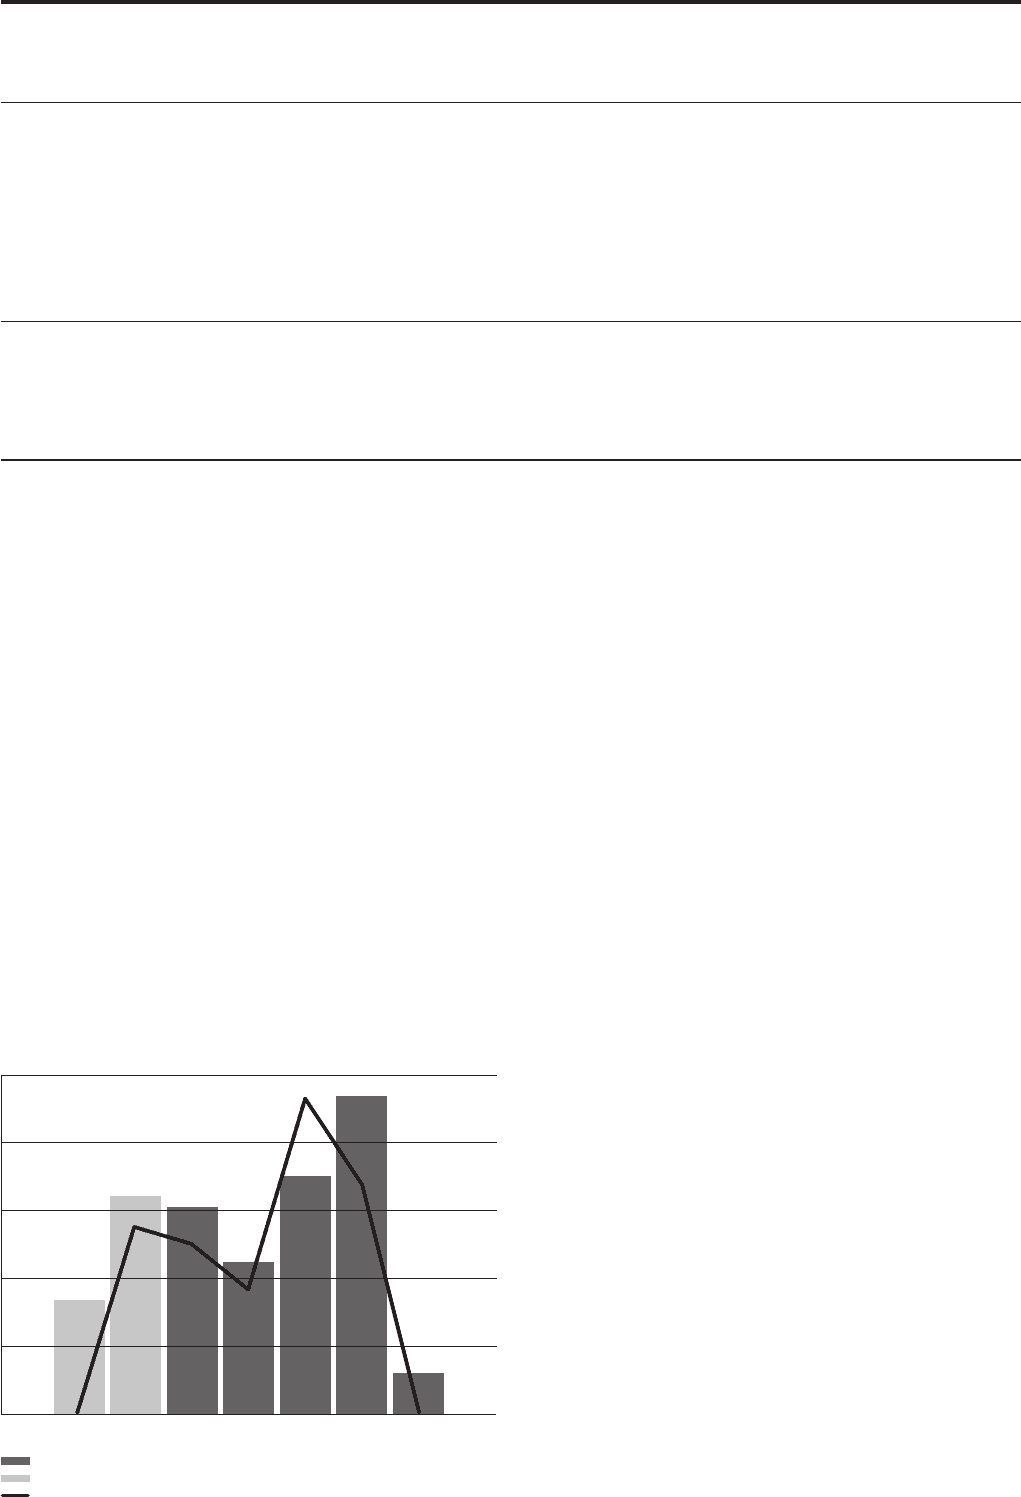
In line with Qantas’ achievement against its financial targets in the past
seven years, cash incentives were:
•notpaidfor2002/03;
•paidat110percentoftargetfor2003/04;
•paidat100percentoftargetfor2004/05;
•paidat73percentoftargetfor2005/06;
•paidat186percentoftargetfor2006/07;
•paidat135percentoftargetfor2007/08;and
•notpaidfor2008/09.
The graph below shows Qantas’ full year profit before related income tax
expense and the percentage of target cash incentives that were paid to
Executives over the past seven financial years.
Relationship between Employee Equity and Qantas’ Performance
From 2004/05 to 2006/07, the link between reward under the LTIP and
Qantas’ performance has been established in terms of TSR performance
againsttheS&P/ASX100Indexandabasketofinternationalairlines.For
2007/08 and 2008/09 vesting under the long-term equity program will
dependonQantas’performanceonTSRagainsttheS&P/ASX100Index
and extent of achievement of an EPS growth target.
To achieve full vesting under the LTIP, Qantas must achieve a three year TSR
performancethatexceeds75percentofcompaniesintheS&P/ASX100
Index as well as achieving a challenging three year EPS target.
Allocations under the 2008/09 PSP have been dependent on the corporate
performance of Qantas against a Balanced Scorecard.
One hundred per cent of the target level of deferred shares were awarded
to Executives in 2003/04 and 2004/05, 95 per cent in 2005/06, 80 per cent
in 2006/07 and 91 per cent in 2007/08. On 18 August 2009 the Board
approved an award of 60 per cent of the target level of deferred shares,
based on performance against the Balanced Scorecard.
The TSR performance of Qantas for the three years ended 30 June 2009,
calculated in accordance with the 2006 Performance Rights Plan rules, was
(17) per cent, which ranked at the 60th percentile among companies that
comprisetheS&P/ASX100Indexforthisperiod.
Remuneration Report (Audited) continued
40%
80%
120%
160%
200%
300
600
900
1,200
1,500
2003 2004 2005 2006 2007 2008 2009
Profit before related income tax expense – A-IFRS
Profit from ordinary activities before income tax expense – previous GAAP
% of target cash incentives paid
$million