Qantas 2009 Annual Report Download - page 100
Download and view the complete annual report
Please find page 100 of the 2009 Qantas annual report below. You can navigate through the pages in the report by either clicking on the pages listed below, or by using the keyword search tool below to find specific information within the annual report.-
 1
1 -
2
-
3
-
4
-
5
-
6
-
7
-
8
-
9
-
10
-
11
-
12
-
13
-
14
-
15
-
16
-
17
-
18
-
19
-
20
-
21
-
22
-
23
-
24
-
25
-
26
-
27
-
28
-
29
-
30
-
31
-
32
-
33
-
34
-
35
-
36
-
37
-
38
-
39
-
40
-
41
-
42
-
43
-
44
-
45
-
46
-
47
-
48
-
49
-
50
-
51
-
52
-
53
-
54
-
55
-
56
-
57
-
58
-
59
-
60
-
61
-
62
-
63
-
64
-
65
-
66
-
67
-
68
-
69
-
70
-
71
-
72
-
73
-
74
-
75
-
76
-
77
-
78
-
79
-
80
-
81
-
82
-
83
-
84
-
85
-
86
-
87
-
88
-
89
-
 90
90 -
 91
91 -
 92
92 -
 93
93 -
 94
94 -
 95
95 -
 96
96 -
 97
97 -
 98
98 -
 99
99 -
 100
100 -
 101
101 -
 102
102 -
 103
103 -
 104
104 -
 105
105 -
 106
106 -
 107
107 -
 108
108 -
 109
109 -
 110
110 -
111
-
112
-
113
-
114
-
115
-
116
-
117
-
118
-
119
-
120
-
121
-
122
-
123
-
124
-
125
-
126
-
127
-
128
-
129
-
130
-
131
-
132
-
133
-
134
-
135
-
136
-
137
-
138
-
139
-
140
-
141
-
142
-
143
-
144
-
145
-
146
-
147
-
148
-
149
-
150
-
151
-
152
-
153
-
154
-
155
-
156
-
157
-
158
-
159
-
160
-
161
-
162
-
163
-
164
 |
 |

98 Qantas Annual Report 2009
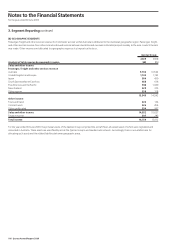
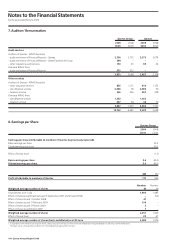
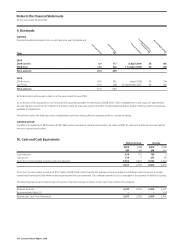
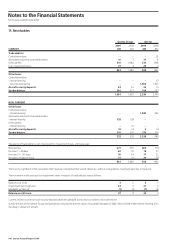
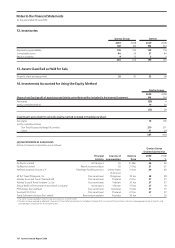
Notes to the Financial Statements
for the year ended 30 June 2009
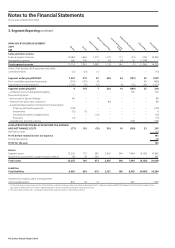
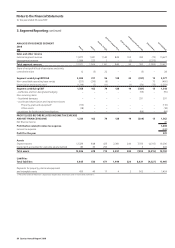
3. Segment Reporting continued
ANALYSIS BY BUSINESS SEGMENT
2009
$M
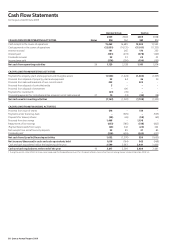
Sales and other income
External segment revenue 10,784 1,646 1,077 1,103 117 (23) (152) 14,552
Intersegment revenue 926 205 3 30 28 16 (1,208) –
Total segment revenue 11,710 1,851 1,080 1,133 145 (7) (1,360) 14,552
Share of net (loss)/profit of associates and jointly
controlled entities (13) (15) 13 – – – – (15)
Segment underlying EBITDAR1 1,363 373 25 226 22 (137) 33 1,905
Non-cancellable operating lease rentals (253) (251) (6) – – – 60 (450)
Depreciation and amortisation2 (1,106) (15) (12) – (6) (52) (60) (1,251)
Segment underlying EBIT 4 107 7 226 16 (189) 33 204
– ineffective and non-designated hedging – – – – – 105 – 105
Non-recurring items:
– gain on sale of Qantas Holidays 86 – – – – – – 86
– revenue from direct earn conversion1 – – – 84 – – – 84
– accelerated depreciation and impairment (losses)/gains
Property, plant and equipment2 (139) – – – – – – (139)
Investments (15) 19 – – – – – 4
Goodwill and other intangible assets – – (22) – – – – (22)
Provisions (13) – – – – – – (13)
– redundancies and restructuring – – – – – (106) – (106)
(LOSS)/PROFIT BEFORE RELATED INCOME TAX EXPENSE
AND NET FINANCE COSTS (77) 126 (15) 310 16 (190) 33 203
Net finance costs (22)
Profit before related income tax expense 181
Income tax expense (58)
Profit for the year 123
Assets
Segment assets 12,205 757 382 2,616 364 7,494 (4,156) 19,662
Investments accounted for using the equity method 58 39 290 – – – – 387
Total assets 12,263 796 672 2,616 364 7,494 (4,156) 20,049
Liabilities
Total liabilities 6,650 656 651 2,137 168 8,518 (4,496) 14,284
Payments for property, plant and equipment
and intangible assets 802 24 12 – – 692 – 1,530
1. Of the net change in accounting estimates of $16 4 million in relation to frequent flyer accounting as described in Note 1, Segment underlying EBITDAR includes $80 million (Qantas Frequent Flyer
$63 million and Eliminations $17 million) representing the six month impact of the change in accounting estimate.
2. The combination of these lines is reported as Depreciation and amortisation in the Income Statement.
Qantas
Jetstar
Qantas Frequent Flyer
Jetset Travelworld
Group
Corporate/Unallocated
Eliminations
Consolidated
Qantas Freight