Qantas 2009 Annual Report Download - page 144
Download and view the complete annual report
Please find page 144 of the 2009 Qantas annual report below. You can navigate through the pages in the report by either clicking on the pages listed below, or by using the keyword search tool below to find specific information within the annual report.-
 1
1 -
2
-
3
-
4
-
5
-
6
-
7
-
8
-
9
-
10
-
11
-
12
-
13
-
14
-
15
-
16
-
17
-
18
-
19
-
20
-
21
-
22
-
23
-
24
-
25
-
26
-
27
-
28
-
29
-
30
-
31
-
32
-
33
-
34
-
35
-
36
-
37
-
38
-
39
-
40
-
41
-
42
-
43
-
44
-
45
-
46
-
47
-
48
-
49
-
50
-
51
-
52
-
53
-
54
-
55
-
56
-
57
-
58
-
59
-
60
-
61
-
62
-
63
-
64
-
65
-
66
-
67
-
68
-
69
-
70
-
71
-
72
-
73
-
74
-
75
-
76
-
77
-
78
-
79
-
80
-
81
-
82
-
83
-
84
-
85
-
86
-
87
-
88
-
89
-
90
-
91
-
92
-
93
-
94
-
95
-
96
-
97
-
98
-
99
-
100
-
101
-
102
-
103
-
104
-
105
-
106
-
107
-
108
-
109
-
110
-
111
-
112
-
113
-
114
-
115
-
116
-
117
-
118
-
119
-
120
-
121
-
122
-
123
-
124
-
125
-
126
-
127
-
128
-
129
-
130
-
131
-
132
-
133
-
 134
134 -
 135
135 -
 136
136 -
 137
137 -
 138
138 -
 139
139 -
 140
140 -
 141
141 -
 142
142 -
 143
143 -
 144
144 -
 145
145 -
 146
146 -
 147
147 -
 148
148 -
 149
149 -
 150
150 -
 151
151 -
 152
152 -
 153
153 -
 154
154 -
155
-
156
-
157
-
158
-
159
-
160
-
161
-
162
-
163
-
164
 |
 |
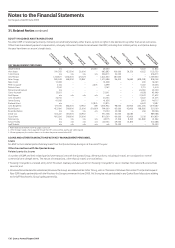
142 Qantas Annual Report 2009
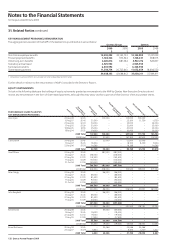
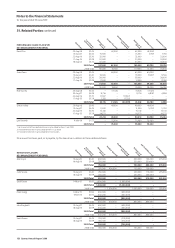
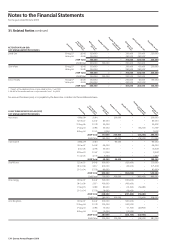
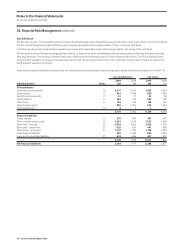
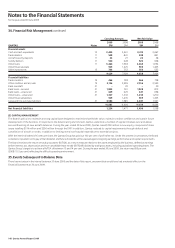
Notes to the Financial Statements
for the year ended 30 June 2009
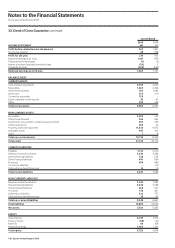
33. Deed of Cross Guarantee continued
Consolidated
2009 2008
INCOME STATEMENT $M $M
Profit before related income tax expense 322 1,391
Incometaxexpense 48 438
Profit for the year 274 953
Retained earnings as at 1 July 1,191 876
Shares vested to employees (1) (5)
Impactofentities(leaving)/joiningtheDeed (20) 7
Dividends declared (439) (640)
Retained earnings as at 30 June 1,005 1,191
BALANCE SHEET
CURRENT ASSETS
Cash and cash equivalents 3,309 2,445
Receivables 1,324 2,338
Other financial assets 561 1,082
Inventories 250 210
Currenttaxreceivable 128 –
Assets classified as held for sale 26 41
Other 302 245
Total current assets 5,900 6,361
NON-CURRENT ASSETS
Receivables 2,396 532
Other financial assets 344 462
Investments accounted for using the equity method 295 329
Other investments 394 74
Property, plant and equipment 11,833 11,952
Intangibleassets 447 412
Other 7 8
Total non-current assets 15,716 13,769
Total assets 21,616 20,130
CURRENT LIABILITIES
Payables 1,732 2,220
Revenue received in advance 3,033 3,266
Interest-bearingliabilities 726 634
Othernancialliabilities 641 960
Provisions 499 480
Currenttaxliabilities – 110
Deferredleasebenets/income 16 15
Total current liabilities 6,647 7,685
NON-CURRENT LIABILITIES
Revenue received in advance 1,232 1,083
Interest-bearingliabilities 6,626 3,958
Othernancialliabilities 268 597
Provisions 516 421
Deferredtaxliabilities 572 757
Deferredleasebenets/income 35 45
Total non-current liabilities 9,249 6,861
Total liabilities 15,896 14,546
Net assets 5,720 5,584
EQUITY
Issued capital 4,729 3,976
Treasury shares (58) (61)
Reserves 44 478
Retained earnings 1,005 1,191
Total equity 5,720 5,584