Qantas 2009 Annual Report Download - page 75
Download and view the complete annual report
Please find page 75 of the 2009 Qantas annual report below. You can navigate through the pages in the report by either clicking on the pages listed below, or by using the keyword search tool below to find specific information within the annual report.-
 1
1 -
2
-
3
-
4
-
5
-
6
-
7
-
8
-
9
-
10
-
11
-
12
-
13
-
14
-
15
-
16
-
17
-
18
-
19
-
20
-
21
-
22
-
23
-
24
-
25
-
26
-
27
-
28
-
29
-
30
-
31
-
32
-
33
-
34
-
35
-
36
-
37
-
38
-
39
-
40
-
41
-
42
-
43
-
44
-
45
-
46
-
47
-
48
-
49
-
50
-
51
-
52
-
53
-
54
-
55
-
56
-
57
-
58
-
59
-
60
-
61
-
62
-
63
-
64
-
 65
65 -
 66
66 -
 67
67 -
 68
68 -
 69
69 -
 70
70 -
 71
71 -
 72
72 -
 73
73 -
 74
74 -
 75
75 -
 76
76 -
 77
77 -
 78
78 -
 79
79 -
 80
80 -
 81
81 -
 82
82 -
 83
83 -
 84
84 -
 85
85 -
86
-
87
-
88
-
89
-
90
-
91
-
92
-
93
-
94
-
95
-
96
-
97
-
98
-
99
-
100
-
101
-
102
-
103
-
104
-
105
-
106
-
107
-
108
-
109
-
110
-
111
-
112
-
113
-
114
-
115
-
116
-
117
-
118
-
119
-
120
-
121
-
122
-
123
-
124
-
125
-
126
-
127
-
128
-
129
-
130
-
131
-
132
-
133
-
134
-
135
-
136
-
137
-
138
-
139
-
140
-
141
-
142
-
143
-
144
-
145
-
146
-
147
-
148
-
149
-
150
-
151
-
152
-
153
-
154
-
155
-
156
-
157
-
158
-
159
-
160
-
161
-
162
-
163
-
164
 |
 |

73 Qantas Annual Report 2009
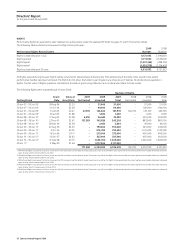
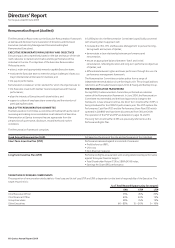
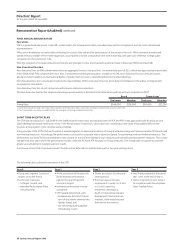
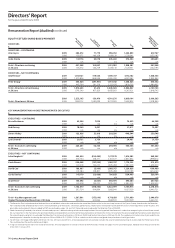
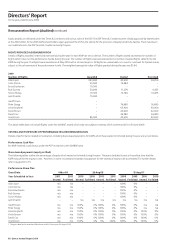
Directors’ Report
for the year ended 30 June 2009
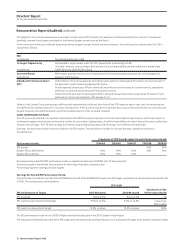
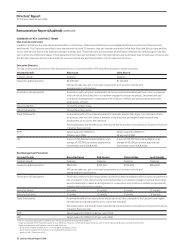
In years where a cash bonus was paid, payments for each Executive were calculated as follows:
FAR
multiplied by The individual Executive’s FAR.
‘at target’ Opportunity An individual’s target reward under the PCP, expressed as a percentage of FAR and varies according to the
multiplied by Executive’s level of responsibility.
Company Factor The Board assessed the audited Qantas Group PBT result against the target and determines the company factor
(expressed as a percentage).
A company factor of 100 per cent results when the target PBT is achieved. A company factor of 50 per cent result
multiplied by when a threshold PBT result (being 75 per cent of target) is achieved.
Individual Performance Factor At the end of the year, each Executives performance against KPIs is assessed and each Executive is assigned an IPF.
(IPF) Across all participants, IPF’s average to 1.0.
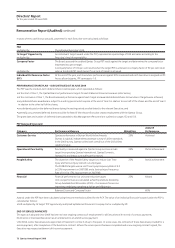
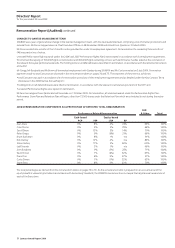
PERFORMANCE SHARE PLAN – DISCONTINUED AT 30 JUNE 2009
The PSP was the medium-term deferred share incentive plan, which operated as follows:
•atthestartofYear1,theQantasBoardsetperformancetargetsforeachBalancedScorecardmeasure(referbelow);
•attheconclusionofYear1,theBoardassessedperformanceagainsteachtargetandawardeddeferredsharestoExecutivesiftargetswereachieved;
•anydeferredsharesawardedaresubjecttoavestingperiodwhichexpiresattheendofYear2inrelationtoonehalfofthesharesandtheendofYear3
inrelationtotheotherhalfoftheshares;
•anydividendspaidonthedeferredsharesduringthevestingperiodaredistributedtotherelevantExecutive;and
•generally,anyunvesteddeferredshareswouldbeforfeitediftherelevantExecutiveceasesemploymentwiththeQantasGroup.
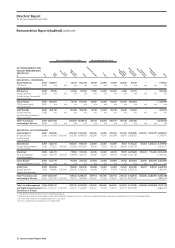
The grant date and number of deferred shares awarded to Key Management Personnel are outlined on pages 132 and 133.
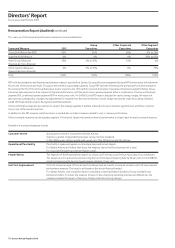
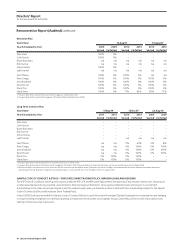
PSP Balanced Scorecard
2008/09
Category Performance Measure Weighting Performance
Customer Service Qantas performance in Skytrax World Airline Awards. 25% Achieved
Skytrax is a global, independent passenger survey of airline standards.
In the 2009 survey, Qantas ranked sixth overall out of the 203 airlines
rated by Skytrax.
Operational Punctuality Punctuality is measured against a Qantas Group on-time arrivals 25% Partial achievement
target (incorporating Qantas International, Qantas Domestic,
QantasLink and Jetstar punctuality performance).
People/Safety The objective of the People/Safety target is to reduce Lost Time 25% Partial achievement
Injury and Serious Injury rates of our employees.
The 2008/09 targets were a Lost Time Injury Frequency Rate of 4.0
(a 22% improvement on 2007/08) and a Serious Injury Frequency
Rate of 10.6 (a 17% improvement on 2007/08).
Financial Financial performance is a unit cost reduction target. 25% Missed
Unit cost performance is calculated as Net Expenditure divided by
Group Available Seat Kilometres (ASKs) – the measure focuses on
improving underlying operating activities and efficiencies.
Balanced Scorecard Company Factor 60%
Awards under the PSP have been calculated using the same methods outlined for the PCP. The value of an individual Executive’s award under the PSP is
calculated as follows:
•FARmultipliedby‘attarget’PSPopportunitymultipliedbyBalancedScorecardCompanyFactormultipliedbyIPF.
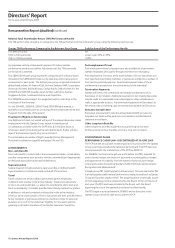
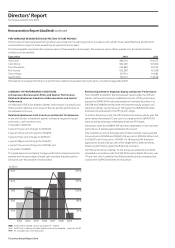
END OF SERVICE PAYMENTS
The approach adopted since 2006 has been to have ongoing contracts of employment for all Executives with no end of contract payments.
No Director or Disclosed Executive has an entitlement to an end of service payment.
Until 2004, senior Executives were appointed on fixed-term contracts of up to five years. In some cases, the contracts of these Executives provided for a
service payment, after completion of the fixed-term contract. Where the service period has been completed and a new ongoing contract signed, the
Executive may request settlement of the service payment.
Remuneration Report (Audited) continued