Qantas 2009 Annual Report Download - page 132
Download and view the complete annual report
Please find page 132 of the 2009 Qantas annual report below. You can navigate through the pages in the report by either clicking on the pages listed below, or by using the keyword search tool below to find specific information within the annual report.-
 1
1 -
2
-
3
-
4
-
5
-
6
-
7
-
8
-
9
-
10
-
11
-
12
-
13
-
14
-
15
-
16
-
17
-
18
-
19
-
20
-
21
-
22
-
23
-
24
-
25
-
26
-
27
-
28
-
29
-
30
-
31
-
32
-
33
-
34
-
35
-
36
-
37
-
38
-
39
-
40
-
41
-
42
-
43
-
44
-
45
-
46
-
47
-
48
-
49
-
50
-
51
-
52
-
53
-
54
-
55
-
56
-
57
-
58
-
59
-
60
-
61
-
62
-
63
-
64
-
65
-
66
-
67
-
68
-
69
-
70
-
71
-
72
-
73
-
74
-
75
-
76
-
77
-
78
-
79
-
80
-
81
-
82
-
83
-
84
-
85
-
86
-
87
-
88
-
89
-
90
-
91
-
92
-
93
-
94
-
95
-
96
-
97
-
98
-
99
-
100
-
101
-
102
-
103
-
104
-
105
-
106
-
107
-
108
-
109
-
110
-
111
-
112
-
113
-
114
-
115
-
116
-
117
-
118
-
119
-
120
-
121
-
 122
122 -
 123
123 -
 124
124 -
 125
125 -
 126
126 -
 127
127 -
 128
128 -
 129
129 -
 130
130 -
 131
131 -
 132
132 -
 133
133 -
 134
134 -
 135
135 -
 136
136 -
 137
137 -
 138
138 -
 139
139 -
 140
140 -
 141
141 -
 142
142 -
143
-
144
-
145
-
146
-
147
-
148
-
149
-
150
-
151
-
152
-
153
-
154
-
155
-
156
-
157
-
158
-
159
-
160
-
161
-
162
-
163
-
164
 |
 |

130 Qantas Annual Report 2009
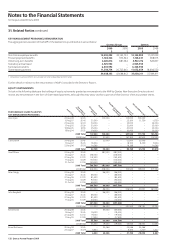
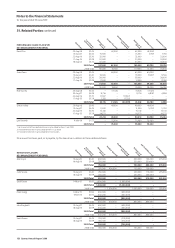
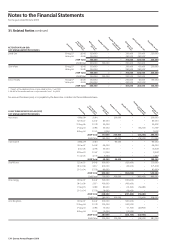
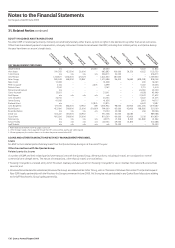
Notes to the Financial Statements
for the year ended 30 June 2009
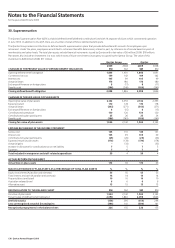
30. Superannuation
TheQantasSuperannuationPlan(QSP)isahybriddenedbenet/denedcontributionfundwith14separatedivisionswhichcommencedoperation
inJune1939.InadditiontotheQSP,thereareanumberofsmalloffshoredenedbenetplans.
TheQantasGroupmakescontributionstodenedbenetsuperannuationplansthatprovidedenedbenetamountsforemployeesupon
retirement.Undertheplans,employeesareentitledtoretirementbenetsdetermined,atleastinpart,byreferencetoaformulabasedonyearsof
membershipandsalarylevels.ThetotalplanassetsincludenancialinstrumentsissuedbyQantaswithafairvalueof$6million(2008:$18million).
Planassetsalsoincludeaninvestmentinatrustwhichownsa50percentinterestinpropertyoccupiedbytheQantasGroup.Thevalueofthis
investment is $28 million (2008: $17 million).
Qantas Group Qantas
2009 2008 2009 2008
CHANGES IN THE PRESENT VALUE OF DEFINED BENEFIT OBLIGATION $M $M $M $M
Openingdenedbenetobligation 1,846 1,691 1,846 1,691
Current service cost 149 142 149 142
Interest cost 105 99 105 99
Actuarial losses 176 180 176 180
Exchangedifferencesonforeignplans 8 (17) 8 (17)
Benefits paid (186) (249) (186) (249)
Closing defined benefit obligation 2,098 1,846 2,098 1,846
CHANGES IN THE FAIR VALUE OF PLAN ASSETS
Opening fair value of plan assets 2,142 2,353 2,142 2,353
Expectedreturn 170 178 170 178
Actuarial losses (343) (271) (343) (271)
Exchangedifferencesonforeignplans 6 (15) 6 (15)
Contributionsbyemployer 130 120 130 120
Contributionsbyplanparticipants 25 26 25 26
Benefits paid (186) (249) (186) (249)
Closing fair value of plan assets 1,944 2,142 1,944 2,142
EXPENSE RECOGNISED IN THE INCOME STATEMENT
Service cost 135 131 135 131
Interest cost 105 99 105 99
Contributionsbyplanparticipants (25) (26) (25) (26)
Expectedreturnonplanassets (170) (178) (170) (178)
Actuarial gains – (33) – (33)
Increaseinallowanceforcontributionstaxonnetliability 7 5 7 5
Expenses 7 6 7 6
Total included in manpower and staff related expenditure 59 4 59 4
ACTUAL RETURN ON PLAN ASSET
Actual loss on plan assets 173 93 173 93
MAJOR CATEGORIES OF PLAN ASSETS AS A PERCENTAGE OF TOTAL PLAN ASSETS % % % %
Equity instruments (Australian and overseas) 55 55 55 55
Fixedinterestandcash(Australianandoverseas) 14 14 14 14
Property (direct and listed) 10 10 10 10
Australianindexedbond 6 6 6 6
Alternative asset 15 15 15 15
RECONCILIATION TO THE BALANCE SHEET $M $M $M $M
Fairvalueofplanassets 1,944 2,142 1,944 2,142
Presentvalueofdenedbenetobligation 2,098 1,846 2,098 1,846
(Deficit)/surplus (154) 296 (154) 296
Less: unrecognised actuarial (losses)/gains (380) 141 (380) 141
Recognised prepayments in the balance sheet 226 155 226 155