Qantas 2009 Annual Report Download - page 87
Download and view the complete annual report
Please find page 87 of the 2009 Qantas annual report below. You can navigate through the pages in the report by either clicking on the pages listed below, or by using the keyword search tool below to find specific information within the annual report.
85 Qantas Annual Report 2009
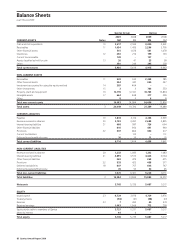
Balance Sheets
as at 30 June 2009
Qantas Group Qantas
2009 2008 2009 2008
CURRENT ASSETS Notes $M $M $M $M
Cash and cash equivalents 10 3,617 2,599 3,404 2,461
Receivables 11 1,054 1,435 2,296 2,705
Other financial assets 561 1,076 561 1,078
Inventories 12 250 216 199 163
Current tax receivable 128 – 137 –
Assets classified as held for sale 13 26 41 23 28
Other 330 249 295 228
Total current assets 5,966 5,616 6,915 6,663
NON-CURRENT ASSETS
Receivables 11 522 532 2,258 785
Other financial assets 344 347 344 347
Investments accounted for using the equity method 14 387 404 – –
Other investments 15 3 3 766 553
Property, plant and equipment 16 12,155 12,341 10,763 10,834
Intangible assets 17 664 448 317 299
Other 8 9 6 8
Total non-current assets 14,083 14,084 14,454 12,826
Total assets 3 20,049 19,700 21,369 19,489
CURRENT LIABILITIES
Payables 19 1,833 2,174 2,156 2,599
Revenue received in advance 20 3,109 3,267 2,688 2,895
Interest-bearing liabilities 21 608 587 726 664
Other financial liabilities 641 960 641 960
Provisions 22 507 484 436 417
Current tax liabilities – 113 – 111
Deferred lease benefits/income 16 19 11 15
Total current liabilities 6,714 7,604 6,658 7,6 61
NON-CURRENT LIABILITIES
Revenue received in advance 20 1,232 1,083 1,232 1,083
Interest-bearing liabilities 21 4,895 3,573 6,626 3,964
Other financial liabilities 268 475 268 475
Provisions 22 533 423 458 377
Deferred tax liabilities 18 607 757 606 767
Deferred lease benefits/income 35 50 34 45
Total non-current liabilities 7,570 6,361 9,224 6,711
Total liabilities 3 14,284 13,965 15,882 14,372
Net assets 5,765 5,735 5,487 5,117
EQUITY
Issued capital 23 4,729 3,976 4,729 3,976
Treasury shares (58) (61) (58) (61)
Reserves 23 7 450 44 474
Retained earnings 1,043 1,366 772 728
Equity attributable to members of Qantas 5,721 5,731 5,487 5,117
Minority interest 44 4 – –
Total equity 5,765 5,735 5,487 5,117


