Qantas 2009 Annual Report Download - page 158
Download and view the complete annual report
Please find page 158 of the 2009 Qantas annual report below. You can navigate through the pages in the report by either clicking on the pages listed below, or by using the keyword search tool below to find specific information within the annual report.-
 1
1 -
2
-
3
-
4
-
5
-
6
-
7
-
8
-
9
-
10
-
11
-
12
-
13
-
14
-
15
-
16
-
17
-
18
-
19
-
20
-
21
-
22
-
23
-
24
-
25
-
26
-
27
-
28
-
29
-
30
-
31
-
32
-
33
-
34
-
35
-
36
-
37
-
38
-
39
-
40
-
41
-
42
-
43
-
44
-
45
-
46
-
47
-
48
-
49
-
50
-
51
-
52
-
53
-
54
-
55
-
56
-
57
-
58
-
59
-
60
-
61
-
62
-
63
-
64
-
65
-
66
-
67
-
68
-
69
-
70
-
71
-
72
-
73
-
74
-
75
-
76
-
77
-
78
-
79
-
80
-
81
-
82
-
83
-
84
-
85
-
86
-
87
-
88
-
89
-
90
-
91
-
92
-
93
-
94
-
95
-
96
-
97
-
98
-
99
-
100
-
101
-
102
-
103
-
104
-
105
-
106
-
107
-
108
-
109
-
110
-
111
-
112
-
113
-
114
-
115
-
116
-
117
-
118
-
119
-
120
-
121
-
122
-
123
-
124
-
125
-
126
-
127
-
128
-
129
-
130
-
131
-
132
-
133
-
134
-
135
-
136
-
137
-
138
-
139
-
140
-
141
-
142
-
143
-
144
-
145
-
146
-
147
-
 148
148 -
 149
149 -
 150
150 -
 151
151 -
 152
152 -
 153
153 -
 154
154 -
 155
155 -
 156
156 -
 157
157 -
 158
158 -
 159
159 -
 160
160 -
 161
161 -
 162
162 -
 163
163 -
 164
164
 |
 |

156 Qantas Annual Report 2009
Sustainability Statistics Definitions
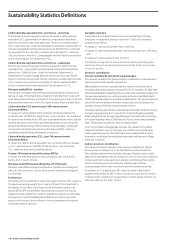
Carbon dioxide equivalent (CO2-e) emissions – electricity
Theamountofgreenhousegasemissionsmeasuredincarbondioxide
equivalent (CO2-e) generated from electricity consumption (as defined
above)bythetotalineachAustralianState,TerritoryorGridDescription
from1Julyto30June.UndertheAustralianGovernment’sDepartmentof
ClimateChangeNationalGreenhouseAccounts(NGA)Factors,emissions
incorporatedintothecalculationincludecarbondioxide(CO2), methane
(CH4)andnitrousoxide(N2O).QantasappliestheNGAFactorsconversions
and methodology for the calculation of CO2-e.
Carbon dioxide equivalent (CO2-e) emissions – natural gas
Theamountofgreenhousegasemissionsmeasuredincarbondioxide
equivalent (CO2-e) generated from Natural Gas consumption (as defined
above)from1Julyto30June.UndertheAustralianGovernment’s
Department of Climate Change National Greenhouse Accounts (NGA)
Factors,emissionsincorporatedintothecalculationincludecarbondioxide
(CO2), methane (CH4)andnitrousoxide(N2O). Qantas applies the NGA
FactorsconversionsandmethodologyforthecalculationofCO2-e.
Nitrogen oxide (NOx) – aviation
Theamountofnitrogenoxide(NOx)producedduringfuelcombustionof
Qantasontake-offandlandingtoaheightof3,000feetfrom1Julyto30
June.NOxemissionsfactorsarebasedontheenginetypeoftheaircraftand
determinedbyreferencetotheICAOEngineExhaustEmissionsDataBank.
Carbon dioxide (CO2) emissions per 100 revenue tonne
kilometres (RTKs)
Ameasureofcarbondioxide(CO2)emissionsefciencybasedonCO2
production per 100 RTKs for Qantas from 1 July to 30 June. CO2 emissions
foraviationaredenedabove.RTKsareastandardindustrymetricusedto
quantifytheamountofrevenuegeneratingpayloadcarried,takinginto
account the distance flown. RTKs comprise the passengers, freight and
mailcarriedmultipliedbytheGreatCircleDistance(GCD),whichisa
standardpublisheddistancebetweentwoairports.
Carbon dioxide equivalent (CO2-e) per 100 revenue tonne
kilometres (RTKs)
AmeasureofcarbondioxideequivalentCO2-eemissionsefciencybased
on CO2-e production per 100 RTKs for Qantas from 1 July to 30 June.
CO2-e emissionsforaviationasdenedabove.
Fuel per 100 revenue tonne kilometres (RTKs)
Ameasureofefciencybasedonfuelconsumptionper100RTKsfor
Qantas from 1 July to 30 June.
Nitrogen oxide (NOx) per landing take-off (LTO) cycle
Nitrogenoxide(NOx)emissionsproducedforQantasisperlandingand
take-off(LTO)cyclefrom1Julyto30Juneandismeasuredinkilograms
per LTO cycle.
Fuel jettison
The release of fuel at altitude to reduce the weight of the aircraft usually to
themaximumlandingweightfrom1Julyto30June.Theonlyaircraftin
theQantasGroup’seetwhichhaveaircraftfueljettisonsystemsare
QantasB747s,B767sandA380s.Typicalsituationswherefuelmaybe
releasedincludeconditionsinwhichanexpeditiouslandingwouldreduce
theexposuretopotentialadditionalproblemsthatcouldcompromise
safety or in the case of serious illness of crew or passengers who require
immediate medical attention.
Fuel spills reported
TheaccidentaldischargeofaviationfuelreportedbyQantasGroup
employees or equipment at airport sites from 1 July to 30 June and is
categorised as follows:
•Category1:spillvolumegreaterthan1,000litres;
•Category2:spillvolumegreaterthan100litresbutlessthan1,000litres;
and
•Category3:spillvolumelessthan100litres.
TheQantasGroupaimstominimisefuturespillsbyidentifyingthe
events resulting in aviation fuel spill occurrences and to put in place
corrective actions.
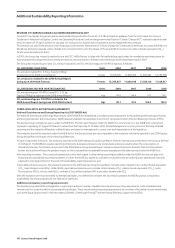
Economic contribution
Tourism spending by Qantas Group passengers
ThismeasurecomprisestheQantasGroup’scontributiontonationalexport
revenueanddomestictravellerexpenditure.
Nationalexportrevenueiscalculatedbythenumberofinboundvisitors
broughttoAustraliabyQantasandJetstarforthe12monthsto31May2009
(latestavailabledata)multipliedbytheassumedvisitorexpenditure(basedon
theaverageexpenditurepervisitoraccordingtoTourismAustralia’sMarch
2009InternationalVisitorSurvey(latestavailabledata)).Thisamountdoesnot
include the value of airfare and freight charges that accrue to Qantas from
overseassourceswhichalsorepresentexportrevenue.
DomestictravellerexpenditureiscalculatedasthenumberofQantasGroup
domesticpassengersforthe12monthsto31May2009(latestavailable
data)multipliedbytheaverageexpenditureperovernightvisitoraccording
toTourismAustralia’sMarch2009NationalVisitorSurvey(latestavailable
data). This amount includes the value of related airfares.
Asitisnotpossibletodisaggregatethedata,thecalculationshouldbe
viewed as indicative only e.g. the figure may include some international
visitorexpenditure(wheredomesticightsarepurchasedafterarrivalin
Australia)orunderstatetheexpenditureassociatedwithdomesticights
whichare‘roundtrip’.
Indirect economic contribution
ThismeasurecomprisesQantasGrouprevenuemultipliedbyaQantas
Groupeconomicmultiplierof2.1(ascalculatedbyAccessEconomics).
The multiplier is derived from Australian Bureau of Statistics input-output
tablesoftheAustralianeconomy.AccessEconomicsisaneconomicadvisory
companywhichprovidesexpertiseinanalysis,modellingandforecasting.
AccessEconomicswascommissionedbyQantastogainabetter
understandingoftheGroup’scontributiontotheAustralianeconomy.
A multiplier of 2.1 suggests that a $1 million increase in demand for
Qantas’servicesleadstoa$2.1millionincreaseinoutputfromallsectors
in the economy, including air transportation. In other words, the flow-on
effects to other sectors is $1.1 million.