Qantas 2009 Annual Report Download - page 78
Download and view the complete annual report
Please find page 78 of the 2009 Qantas annual report below. You can navigate through the pages in the report by either clicking on the pages listed below, or by using the keyword search tool below to find specific information within the annual report.-
 1
1 -
2
-
3
-
4
-
5
-
6
-
7
-
8
-
9
-
10
-
11
-
12
-
13
-
14
-
15
-
16
-
17
-
18
-
19
-
20
-
21
-
22
-
23
-
24
-
25
-
26
-
27
-
28
-
29
-
30
-
31
-
32
-
33
-
34
-
35
-
36
-
37
-
38
-
39
-
40
-
41
-
42
-
43
-
44
-
45
-
46
-
47
-
48
-
49
-
50
-
51
-
52
-
53
-
54
-
55
-
56
-
57
-
58
-
59
-
60
-
61
-
62
-
63
-
64
-
65
-
66
-
67
-
 68
68 -
 69
69 -
 70
70 -
 71
71 -
 72
72 -
 73
73 -
 74
74 -
 75
75 -
 76
76 -
 77
77 -
 78
78 -
 79
79 -
 80
80 -
 81
81 -
 82
82 -
 83
83 -
 84
84 -
 85
85 -
 86
86 -
 87
87 -
 88
88 -
89
-
90
-
91
-
92
-
93
-
94
-
95
-
96
-
97
-
98
-
99
-
100
-
101
-
102
-
103
-
104
-
105
-
106
-
107
-
108
-
109
-
110
-
111
-
112
-
113
-
114
-
115
-
116
-
117
-
118
-
119
-
120
-
121
-
122
-
123
-
124
-
125
-
126
-
127
-
128
-
129
-
130
-
131
-
132
-
133
-
134
-
135
-
136
-
137
-
138
-
139
-
140
-
141
-
142
-
143
-
144
-
145
-
146
-
147
-
148
-
149
-
150
-
151
-
152
-
153
-
154
-
155
-
156
-
157
-
158
-
159
-
160
-
161
-
162
-
163
-
164
 |
 |

76 Qantas Annual Report 2009
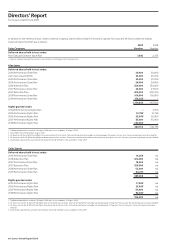
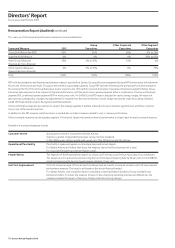
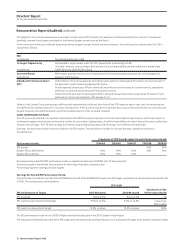
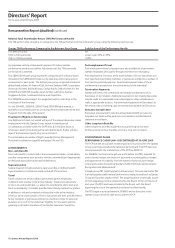
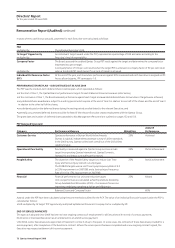
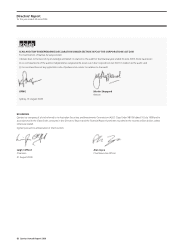
Directors’ Report
for the year ended 30 June 2009
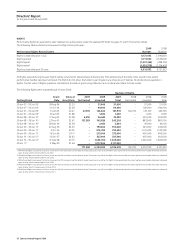
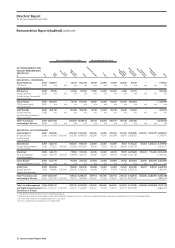
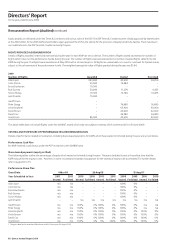
EQUITY SET TLED SHARE-BASED PAYMENT
DIRECTORS
$
DIRECTORS – CONTINUING
Alan Joyce 2009 284,372 71,779 896,742 1,252,893 657,767
2008 138,572 146,209 2,036,130 2,320,911 1,632,195
Colin Storrie 2009 137,176 33,078 405,240 575,494 299,691
2008 n/a n/a n/a n/a n/a
Total – Directors continuing 2009 421,548 104,857 1,301,982 1,828,387 957,458
at 30 June 2008 138,572 146,209 2,036,130 2,320,911 1,632,195
DIREC TORS – NOT CONTINUING
Geoff Dixon 3 2009 1,357,121 319,544 1,495,517 3,172,182 1,548,553
2008 1,275,836 656,044 4,455,383 6,387,263 3,855,843
Peter Gregg3 2009 453,524 (297,931) 1,513,032 1,668,625 554,552
2008 465,704 281,576 2,232,478 2,979,758 1,990,902
Total – Directors not continuing 2009 1,810,645 21,613 3,008,549 4,840,807 2,103,105
at 30 June 2008 1,741,540 937,620 6,687,861 9,367,021 5,846,745
20 09 2,232,193 126,470 4,310,531 6,669,194 3,060,563
Total – Directors at 30 June 20 08 1,880,112 1,083,829 8,723,991 11,687,932 7,478,940
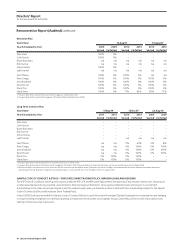
KEY MANAGEMENT AND HIGHEST REMUNERATED EXECUTIVES
$
EXECUTIVES – CONTINUING
Bruce Buchanan 20 09 63,504 7,025 – 70,529 66,258
2008 n/a n/a n/a n/a n/a
Rob Gurney 2009 18,060 3,451 – 21,511 13,497
2008 n/a n/a n/a n/a n/a
Simon Hickey 2009 122,936 32,018 293,590 448,544 250,746
2008 n/a n/a n/a n/a n/a
Lyell Strambi4 20 09 20,731 3,750 – 24,481 31,159
2008 n/a n/a n/a n/a n/a
Total – Executives continuing 2009 225,231 46,244 293,590 565,065 361,660
at 30 June 2008 n/a n/a n/a n/a n/a
EXECUTIVES – NOT CONTINUING
John Borghetti3 2009 453,524 (254,454) 1,217,915 1,416,985 569,542
2008 465,704 236,571 2,101,577 2,803,852 1,999,512
Kevin Brown 3 2009 244,408 (137,953) 1,068,767 1,175,222 512,479
2008 123,218 134,233 1,835,788 2,093,239 1,493,533
David Cox 3 2009 166,967 (5,906) 1,068,767 1,229,828 600,480
2008 101,584 109,827 1,835,788 2,047,199 1,454,143
Curtis Davies3 2009 147,179 (13,438) 700,659 834,400 328,194
2008 n/a n/a n/a n/a n/a
Grant Fenn 3 2009 130,492 (6,503) 366,491 490,480 267,723
2008 123,218 134,233 1,835,788 2,093,239 1,493,533
Total – Executives not continuing 20 09 1,142,570 (418, 254) 4,422,599 5,146,915 2,278,418
at 30 June 2008 813,724 614,864 7,608,941 9,037,529 6,440,721
Total – Key Management and 2009 1,367,801 (372,010) 4,716,189 5,711,980 2,640,078
Highest Remunerated Executives at 30 June 2008 813,724 614,864 7,608,941 9,037,529 6,440,721
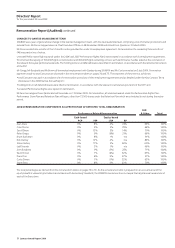
1. The Retention Plan involved awards of deferred shares to individuals whose roles and contribution were identified as critical to the continued success of the Qantas Group. Awards under the Retention
Plan involved awards of deferred shares with a service period of up to three years. Satisfactory performance, which involves achievement of personal KPIs was a further requirement under this plan. The
grant dates and number of shares awarded to KMPs are outlined on pages 133 and 134. No awards were made under the Retention Plan in 2008/09.
2. Under Accounting Standards, the value of a share -based payment is determined at grant date and recognised over the vesting period. No allowance is made when recognising the value of these awards
for any movement in the share price after grant date before vesting conditions are met and the Executive becomes entitled to the shares. For example, the volume weighted share price used to determine
the accounting value of grants issued under the Retention Plan to Executive Directors in 2008 was $5.82 (and to other Executives in 2008 was $5.45). The supplemental market value at year end of share-
based payments is based on the closing share price at 30 June 2009 of $2.01 (2008: $3.04) as a substitute for the volume weighted share price determined at grant date.
3. For Mr Dixon, Mr Gregg, Mr Borghetti, Mr Brown, Mr Cox, Mr Davies and Mr Fenn, share-based payment remuneration includes the value of accelerated vesting of awards under the Performance Share
Plan and Retention Plan and the forfeiture of Right s.
4. A sign-on award of 75,000 shares was made to Mr Strambi. The award operates in a similar manner to the PSP awards. Awards are subject to a ten-year holding lock, however Mr Strambi can call for the
shares from 1 January 2011.
Remuneration Report (Audited) continued
Performance
Share Plan
Long Term
Incentive Plan
Retention
Plan1
Supplemental
Market Value
at 30 June2
Total