Qantas 2009 Annual Report Download - page 101
Download and view the complete annual report
Please find page 101 of the 2009 Qantas annual report below. You can navigate through the pages in the report by either clicking on the pages listed below, or by using the keyword search tool below to find specific information within the annual report.-
 1
1 -
2
-
3
-
4
-
5
-
6
-
7
-
8
-
9
-
10
-
11
-
12
-
13
-
14
-
15
-
16
-
17
-
18
-
19
-
20
-
21
-
22
-
23
-
24
-
25
-
26
-
27
-
28
-
29
-
30
-
31
-
32
-
33
-
34
-
35
-
36
-
37
-
38
-
39
-
40
-
41
-
42
-
43
-
44
-
45
-
46
-
47
-
48
-
49
-
50
-
51
-
52
-
53
-
54
-
55
-
56
-
57
-
58
-
59
-
60
-
61
-
62
-
63
-
64
-
65
-
66
-
67
-
68
-
69
-
70
-
71
-
72
-
73
-
74
-
75
-
76
-
77
-
78
-
79
-
80
-
81
-
82
-
83
-
84
-
85
-
86
-
87
-
88
-
89
-
90
-
 91
91 -
 92
92 -
 93
93 -
 94
94 -
 95
95 -
 96
96 -
 97
97 -
 98
98 -
 99
99 -
 100
100 -
 101
101 -
 102
102 -
 103
103 -
 104
104 -
 105
105 -
 106
106 -
 107
107 -
 108
108 -
 109
109 -
 110
110 -
 111
111 -
112
-
113
-
114
-
115
-
116
-
117
-
118
-
119
-
120
-
121
-
122
-
123
-
124
-
125
-
126
-
127
-
128
-
129
-
130
-
131
-
132
-
133
-
134
-
135
-
136
-
137
-
138
-
139
-
140
-
141
-
142
-
143
-
144
-
145
-
146
-
147
-
148
-
149
-
150
-
151
-
152
-
153
-
154
-
155
-
156
-
157
-
158
-
159
-
160
-
161
-
162
-
163
-
164
 |
 |
99 Qantas Annual Report 2009
Notes to the Financial Statements
for the year ended 30 June 2009
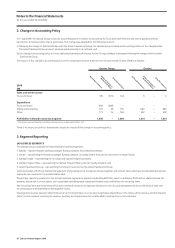
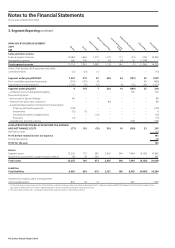
3. Segment Reporting continued
ANALYSIS BY BUSINESS SEGMENT
2008
$M
Sales and other income
External segment revenue 11,877 1,341 1,140 849 100 392 (72) 15,627
Intersegment revenue 1,094 223 1 – (1) – (1,317) –
Total segment revenue 12,971 1,564 1,141 849 99 392 (1,389) 15,627
Share of net profit/(loss) of associates and jointly
controlled entities 12 (3) 22 – – (3) – 28
Segment underlying EBITDAR 2,834 317 96 128 20 (331) 13 3,077
Non-cancellable operating lease rentals (257) (210) (6) – – – 73 (400)
Depreciation and amortisation1 (1,219) (5) (11) – (1) (50) (73) (1,359)
Segment underlying EBIT 1,358 102 79 128 19 (381) 13 1,318
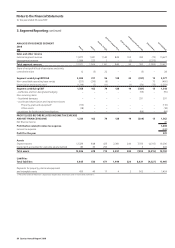
–ineffective and non-designated hedging – – – – – (55) – (55)
Non-recurring items:
– liquidated damages – – – – – 291 – 291
– accelerated depreciation and impairment losses
Property, plant and equipment1 (110) – – – – – – (110)
Other assets (18) – – – – – – (18)
– provisions for freight cartel investigations – – – – – (64) – (64)
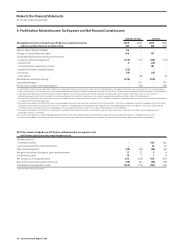
PROFIT/(LOSS) BEFORE RELATED INCOME TA X EXPENSE
AND NET FINANCE INCOME 1,230 102 79 128 19 (209) 13 1,362
Net finance income 46
Profit before related income tax expense 1,408
Income tax expense (438)
Profit for the year 970
Assets
Segment assets 12,326 648 423 2,381 240 7,593 (4,315) 19,296
Investments accounted for using the equity method 80 30 292 – – 2 – 404
Total assets 12,406 678 715 2,381 240 7,595 (4,315) 19,700
Liabilities
Total liabilities 6,445 536 671 1,999 220 8,421 (4,327) 13,965
Payments for property, plant and equipment
and intangible assets 459 40 17 4 2 902 – 1,424
1. The combination of these lines is reported as Depreciation and amor tisation in the Income Statement s.
Qantas
Jetstar
Qantas Frequent Flyer
Qantas Holidays
Corporate/Unallocated
Eliminations
Consolidated
Qantas Freight