Qantas 2008 Annual Report Download - page 95
Download and view the complete annual report
Please find page 95 of the 2008 Qantas annual report below. You can navigate through the pages in the report by either clicking on the pages listed below, or by using the keyword search tool below to find specific information within the annual report.-
 1
1 -
2
-
3
-
4
-
5
-
6
-
7
-
8
-
9
-
10
-
11
-
12
-
13
-
14
-
15
-
16
-
17
-
18
-
19
-
20
-
21
-
22
-
23
-
24
-
25
-
26
-
27
-
28
-
29
-
30
-
31
-
32
-
33
-
34
-
35
-
36
-
37
-
38
-
39
-
40
-
41
-
42
-
43
-
44
-
45
-
46
-
47
-
48
-
49
-
50
-
51
-
52
-
53
-
54
-
55
-
56
-
57
-
58
-
59
-
60
-
61
-
62
-
63
-
64
-
65
-
66
-
67
-
68
-
69
-
70
-
71
-
72
-
73
-
74
-
75
-
76
-
77
-
78
-
79
-
80
-
81
-
82
-
83
-
84
-
 85
85 -
 86
86 -
 87
87 -
 88
88 -
 89
89 -
 90
90 -
 91
91 -
 92
92 -
 93
93 -
 94
94 -
 95
95 -
 96
96 -
 97
97 -
 98
98 -
 99
99 -
 100
100 -
 101
101 -
 102
102 -
 103
103 -
 104
104 -
 105
105 -
106
-
107
-
108
-
109
-
110
-
111
-
112
-
113
-
114
-
115
-
116
-
117
-
118
-
119
-
120
-
121
-
122
-
123
-
124
-
125
-
126
-
127
-
128
-
129
-
130
-
131
-
132
-
133
-
134
-
135
-
136
-
137
-
138
-
139
-
140
-
141
-
142
-
143
-
144
-
145
-
146
-
147
-
148
-
149
-
150
-
151
-
152
-
153
-
154
-
155
-
156
 |
 |

93 Qantas Annual Report 2008
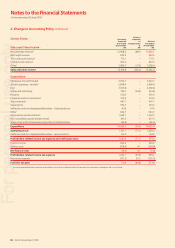
Notes to the Financial Statements
for the year ended 30 June 2008
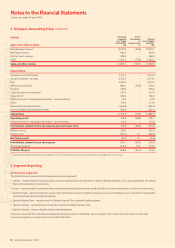
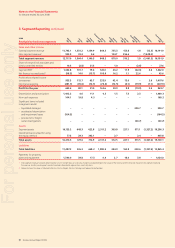
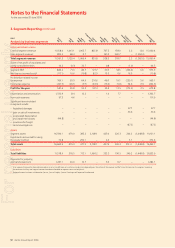
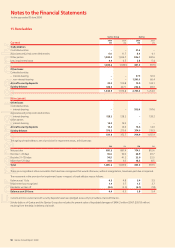
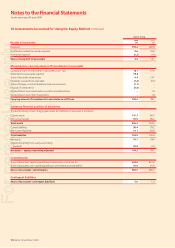
(B) Geographic segments
Passenger, freight and other services revenue from domestic services within Australia is attributed to the Australian geographic region. Passenger,
freight and other services revenue from inbound and outbound services between Australia and overseas is allocated proportionately to the area in
which the sale was made. Other operating income is not allocated to a geographic region as it is impractical to do so.
Qantas Group
Analysis of total revenue by geographic region 2008
$M
2007
$M
Sales and other income
Passenger, freight and other services revenue
Australia 10,562.0 9,591.1
United Kingdom and Europe 1,152.3 1,131.1
Japan 489.7 598.5
South-East Asia/North-East Asia 616.6 571.8
The Americas and the Pacifi c 1,028.8 1,045.6
New Zealand 374.8 417.9
Other regions 318.6 300.4
14,542.8 13,656.4
Other income
Tours and travel revenue 745.8 775.1
Contract work revenue 453.5 434.3
Other unallocated 449.8 194.6
Sales and other income 16,191.9 15,060.4
Finance income 284.7 244.0
Total income 16,476.6 15,304.4
For the year ended 30 June 2008, the principal assets of the Qantas Group comprised the aircraft fl eet, all except eight of which were registered and
domiciled in Australia. These assets are used fl exibly across the Qantas Group’s worldwide route network. Accordingly, there is no suitable basis for
allocating such assets and the related liabilities between geographic areas.
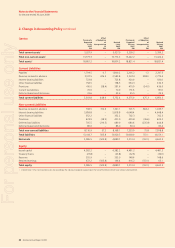
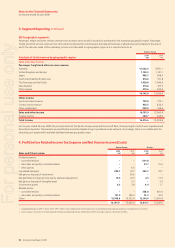
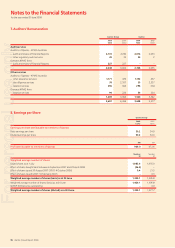
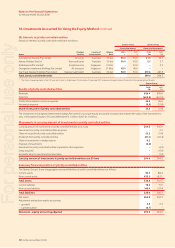
4. Profit before Related Income Tax Expense and Net Finance Income/(Costs)
Qantas Group Qantas
Sales and Other Income 2008
$M
2007
$M
2008
$M
2007
$M
Dividend revenue
controlled entities–––601.8 –
associates and jointly controlled entities–––21.7 16.5
other parties––6.0 ––
Liquidated damages1290.7 97.7 290.7 97.7
Net gain on disposal of investment2–30.6 ––
Net gain/(loss) on disposal of property, plant and equipment 14.9 12.9 4.4 13.3
Net gain on disposal of intangible asset –3.2 –3.2
Government grants 6.5 3.8 4.4 1.7
Related parties
controlled entities –––338.8 461.0
associates and jointly controlled entities–131.0 183.3 73.3 32.2
Other 15,748.8 14,722.9 12,106.0 11,961.4
16,191.9 15,060.4 13,441.1 12,587.0
Liquidated damages of $290.7 million (2007: $97.7 million) were recognised for contracted amounts expected to be receivable due to delays in the delivery of new aircraft.
Qantas Group’s investment in Air New Zealand Limited was sold during the year ended 30 June 2007 resulting in a gain on sale of $30.6 million.
1
2
3. Segment Reporting continued
For personal use only