Qantas 2008 Annual Report Download - page 150
Download and view the complete annual report
Please find page 150 of the 2008 Qantas annual report below. You can navigate through the pages in the report by either clicking on the pages listed below, or by using the keyword search tool below to find specific information within the annual report.-
 1
1 -
2
-
3
-
4
-
5
-
6
-
7
-
8
-
9
-
10
-
11
-
12
-
13
-
14
-
15
-
16
-
17
-
18
-
19
-
20
-
21
-
22
-
23
-
24
-
25
-
26
-
27
-
28
-
29
-
30
-
31
-
32
-
33
-
34
-
35
-
36
-
37
-
38
-
39
-
40
-
41
-
42
-
43
-
44
-
45
-
46
-
47
-
48
-
49
-
50
-
51
-
52
-
53
-
54
-
55
-
56
-
57
-
58
-
59
-
60
-
61
-
62
-
63
-
64
-
65
-
66
-
67
-
68
-
69
-
70
-
71
-
72
-
73
-
74
-
75
-
76
-
77
-
78
-
79
-
80
-
81
-
82
-
83
-
84
-
85
-
86
-
87
-
88
-
89
-
90
-
91
-
92
-
93
-
94
-
95
-
96
-
97
-
98
-
99
-
100
-
101
-
102
-
103
-
104
-
105
-
106
-
107
-
108
-
109
-
110
-
111
-
112
-
113
-
114
-
115
-
116
-
117
-
118
-
119
-
120
-
121
-
122
-
123
-
124
-
125
-
126
-
127
-
128
-
129
-
130
-
131
-
132
-
133
-
134
-
135
-
136
-
137
-
138
-
139
-
 140
140 -
 141
141 -
 142
142 -
 143
143 -
 144
144 -
 145
145 -
 146
146 -
 147
147 -
 148
148 -
 149
149 -
 150
150 -
 151
151 -
 152
152 -
 153
153 -
 154
154 -
 155
155 -
 156
156
 |
 |

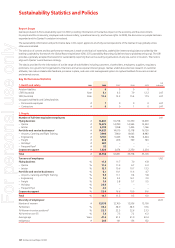
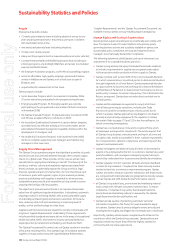
Sustainability Statistics and Policies
148 Qantas Annual Report 2008
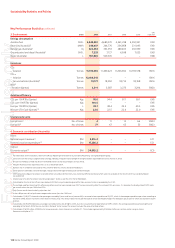
Key Performance Statistics continued
3. Environment Units 2008 2007 2006 2005
GRI
Indicator1
Energy consumption
Aviation fuel 000 L 4,849,430 4,680,270 4,561,238 4,392,991 EN3
Electricity (Australia)7MWh 248,007 246,776 236,858 231,095 EN3
Natural gas (Australia)7Gj 322,354 361,353 289,463 292,959 EN3
Ground petrol and diesel (Australia)7000 L 7,233 7,127 6,99 8 7,023 EN3
Water (Australia) L 907,800 929,305 – – EN8
Emissions
CO2
Aviation–Tonnes11,915,050 11,499,423 11,206,962 10,793,578 EN16
CO2-e
Aviation–Tonnes12,608,518 –––EN16
Ground vehicles (Australia)8
–Tonnes19,177 18,992 18,714 18,768 EN16
NOx9
– Aviation (Qantas) Tonnes 3,511 3,387 3,273 3,294 EN20
Aviation efficiency
CO2 per 100 RTKs (Qantas) Kgs 95.0 94.4 97.1 99.1 EN5
CO2-e per 100 RTKs (Qantas) Kgs 100.5 –––EN5
Fuel per 100 RTKs (Qantas) L 38.7 38.4 39.5 40.3 EN5
NOx per LTO Cycle (Qantas)10 Kgs 22.6 22.5 22.4 22.0 EN5
Unplanned events
Fuel jettison11 No. of times 411 13 n /a E N23
Fuel spills12 No. of times 77 67 65 53 EN23
4. Economic contribution (Australia)
Direct
National export revenue13 $M 5,976.2 –––EC1
Domestic tourism expenditure14 $M 17,256.2 –––EC1
Indirect
Economic output15 $M 34,003.2 –––EC9
For information on the indicators, refer to the GRI G3 Reporting Framework for Sustainability Reporting, www.globalreporting.org.
Consistent with the Group’s Segmentation Strategy, Holidays, Frequent Flyer and Flight Training have been separated from Qantas Airlines in 2008.
The Qantas Holidays Limited and Jetset Travelworld Ltd transaction occurred post 30 June 2008.
Frequent Flyer became a separate business as at 31 December 20 07.
Number and % of Women are based on FTEs; all other diversity statistics based on headcount.
Senior positions defi ned as General Manager, Group General Manager and Executive General Manager.
2007 comparative fi gures have been restated to refl ect actual data for Electricity, Gas and Ground Petrol and Diesel which were not available at the time the 2007 Sustainability Report
was published.
All prior year emissions have been restated using Scope 1 factors as per the AGO Factor Workbook.
Calculated for Qantas jet aircraft emissions below 3,000 feet using standard engine certifi cation emission factors as provided by the ICAO.
The method used for calculating NOx effi ciency performance has been revised since 2007 to more accurately refl ect the nature of NOx emissions. It is based on the landing takeoff (LTO) cycle
per aircraft rather than per 100 million RTKs.
Only Qantas aircraf t have the ability to jettison fuel.
At least 65 per cent of fuel spills were categorised as minor (less than 100 litres).
Calculated as 1,945,377 inbound visitor passengers carried by Qantas and Jetstar (source:ABS) x assumed visitor expenditure of $3,072, which is the average expenditure per visitor according to
the March 2008, Tourism Australia’s International Visitor Survey. This amount does not include the value of airfare and freight charges that foreigners pay to Qantas which also represent export
revenue.
Calculated as 28,904,930 domestic passengers carried by Qantas for all fl ights within Australia x assumed visitor expenditure of $597, which is the average expenditure per overnight visitor
according to the March 2008, Tourism Australia’s National Visitor Survey. This amount includes the value of related airfares.
Calculated as $16,192 million (2008 Qantas Group revenue) x Access Economics multiplier 2.1. This includes approximately $18 billion to the non-aviation sector, using an Access
Economics multiplier of 1.1.
1
2
3
4
5
6
7
8
9
10
11
12
13
14
15
For personal use only