Qantas 2008 Annual Report Download - page 110
Download and view the complete annual report
Please find page 110 of the 2008 Qantas annual report below. You can navigate through the pages in the report by either clicking on the pages listed below, or by using the keyword search tool below to find specific information within the annual report.-
 1
1 -
2
-
3
-
4
-
5
-
6
-
7
-
8
-
9
-
10
-
11
-
12
-
13
-
14
-
15
-
16
-
17
-
18
-
19
-
20
-
21
-
22
-
23
-
24
-
25
-
26
-
27
-
28
-
29
-
30
-
31
-
32
-
33
-
34
-
35
-
36
-
37
-
38
-
39
-
40
-
41
-
42
-
43
-
44
-
45
-
46
-
47
-
48
-
49
-
50
-
51
-
52
-
53
-
54
-
55
-
56
-
57
-
58
-
59
-
60
-
61
-
62
-
63
-
64
-
65
-
66
-
67
-
68
-
69
-
70
-
71
-
72
-
73
-
74
-
75
-
76
-
77
-
78
-
79
-
80
-
81
-
82
-
83
-
84
-
85
-
86
-
87
-
88
-
89
-
90
-
91
-
92
-
93
-
94
-
95
-
96
-
97
-
98
-
99
-
 100
100 -
 101
101 -
 102
102 -
 103
103 -
 104
104 -
 105
105 -
 106
106 -
 107
107 -
 108
108 -
 109
109 -
 110
110 -
 111
111 -
 112
112 -
 113
113 -
 114
114 -
 115
115 -
 116
116 -
 117
117 -
 118
118 -
 119
119 -
 120
120 -
121
-
122
-
123
-
124
-
125
-
126
-
127
-
128
-
129
-
130
-
131
-
132
-
133
-
134
-
135
-
136
-
137
-
138
-
139
-
140
-
141
-
142
-
143
-
144
-
145
-
146
-
147
-
148
-
149
-
150
-
151
-
152
-
153
-
154
-
155
-
156
 |
 |

108 Qantas Annual Report 2008
Notes to the Financial Statements
for the year ended 30 June 2008
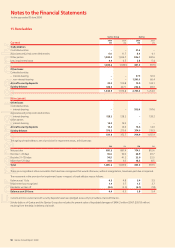
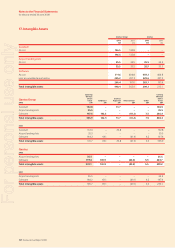
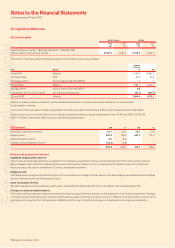
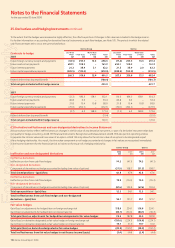
Impairment tests for CGUs containing goodwill and other intangible assets with indefinite useful lives
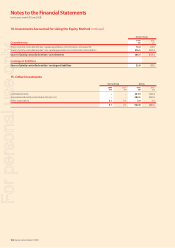
The following CGUs have signifi cant carrying amounts of goodwill and other intangible assets with indefi nite useful lives:
Qantas Group Qantas
2008
$M
2007
$M
2008
$M
2007
$M
Goodwill
Jetstar 90.5 90.5 ––
Qantas Flight Catering 18.2 18.2 ––
Qantas 37.8 24.1 ––
146.5 132.8 ––
Airport landing slots
Qantas 35.5 35.5 35.5 35.5
Jetstar
The recoverable amount of Jetstar CGU is based on value in use calculations. Those calculations use cash fl ow projections based on the three year
plan approved by management and endorsed by the Board. Cash fl ows for a further fi ve years have been extrapolated using an average 8.7 per
cent per annum growth rate out to 2016. This growth rate refl ects the planned expansion of Jetstar both domestically and internationally and
is appropriate given the actual growth achieved since establishment and the Qantas Group’s committed B787 order. For a further 12 years,
a 3.6 per cent per annum growth rate has been assumed, refl ecting long-term infl ation, when extrapolating cash fl ows. The three year plan,
coupled with a 17 year extrapolation, is believed appropriate, as it represents the capital intensive long-term nature of the aviation industry
and the estimated useful life of the assets employed in this CGU.
Qantas Flight Catering
The recoverable amount of Qantas Flight Catering CGU is based on value in use calculations. Those calculations use cash fl ow projections based on
the three year business plan approved by management and endorsed by the Board. Cash fl ows for a further seven years have been extrapolated using
a 3.6 per cent per annum growth rate out to 2018. This growth rate refl ects the mature nature of the airline catering industry and Qantas Flight
Catering’s current market share.
Qantas
The recoverable amount of Qantas CGU is based on value in use calculations. Those calculations use cash fl ow projections based on the three
year plan approved by management and endorsed by the Board. Cash fl ows for a further fi ve years have been extrapolated using an average 8.7
per cent per annum growth rate out to 2016. This growth rate refl ects the planned expansion of Qantas as a result of the introduction into service
of committed aircraft such as the A380 and B787. For a further 15 years, a 3.6 per cent per annum growth rate has been assumed, refl ecting long-
term infl ation, when extrapolating cash fl ows. The three year plan, coupled with a 20 year extrapolation, is believed appropriate, as it represents
the capital intensive long-term nature of the aviation industry and the estimated useful life of the assets employed in this CGU.
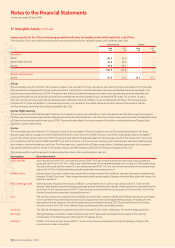
The key assumptions and the approach to determining their value in the current and prior year are:
Assumption How determined
Discount rate A pre-tax discount rate of 11.1 per cent per annum (2007: 10.5 per cent per annum) has been used in discounting the
projected cash fl ows of all CGUs, refl ecting a market estimate of the weighted average cost of capital of the Qantas Group.
This discount would need to exceed 13.3 per cent per annum (2007: 14.1 per cent per annum) before the carrying amount
of any of the CGUs of the Qantas Group would exceed their recoverable amount.
Market share Qantas Group’s domestic market share is expected to remain between 65 and 68 per cent and international market share
between 30 and 35 per cent. These ranges were estimated having regard to Qantas committed fl eet plans and those of its
existing competitors.
Real market growth Market growth, excluding the impacts of infl ation, is estimated to be 5.1 per cent per annum (2007: 3.7 per cent per
annum), refl ecting the long-term average passenger growth experienced by Qantas. Market growth would need to fall by
more than 4.5 per cent per annum (2007: 5.5 per cent per annum) before the carrying amount of any of the CGUs of the
Qantas Group would exceed their recoverable amount.
Fuel The fuel into-plane price is assumed to be US$162 per barrel (2007: between US$89 and US$100) and was set with regard
to the spot West Texas Intermediate crude oil price adjusted for historical average refi ning margins. Providing all other
assumptions remain constant, the fuel into-plane price would need to exceed US$172 per barrel before the carrying
amount of any of the CGUs of the Qantas Group would exceed their recoverable amount.
Currency The US$:A$ exchange rate is assumed to be 93.6 cents (2007: 84.7 cents), refl ecting a 12 month average spot price.
Fleet age Average fl eet age is forecast to remain between nine and 11 years and is estimated having regard to the existing
contractually committed long-term fl eet plan for the Qantas Group.
Inflation Infl ation of 3.6 per cent per annum (2007: 2.5 per cent per annum) represents the long-term average change in the
consumer price index in Australia.
17. Intangible Assets continued
For personal use only