Qantas 2008 Annual Report Download - page 102
Download and view the complete annual report
Please find page 102 of the 2008 Qantas annual report below. You can navigate through the pages in the report by either clicking on the pages listed below, or by using the keyword search tool below to find specific information within the annual report.-
 1
1 -
2
-
3
-
4
-
5
-
6
-
7
-
8
-
9
-
10
-
11
-
12
-
13
-
14
-
15
-
16
-
17
-
18
-
19
-
20
-
21
-
22
-
23
-
24
-
25
-
26
-
27
-
28
-
29
-
30
-
31
-
32
-
33
-
34
-
35
-
36
-
37
-
38
-
39
-
40
-
41
-
42
-
43
-
44
-
45
-
46
-
47
-
48
-
49
-
50
-
51
-
52
-
53
-
54
-
55
-
56
-
57
-
58
-
59
-
60
-
61
-
62
-
63
-
64
-
65
-
66
-
67
-
68
-
69
-
70
-
71
-
72
-
73
-
74
-
75
-
76
-
77
-
78
-
79
-
80
-
81
-
82
-
83
-
84
-
85
-
86
-
87
-
88
-
89
-
90
-
91
-
 92
92 -
 93
93 -
 94
94 -
 95
95 -
 96
96 -
 97
97 -
 98
98 -
 99
99 -
 100
100 -
 101
101 -
 102
102 -
 103
103 -
 104
104 -
 105
105 -
 106
106 -
 107
107 -
 108
108 -
 109
109 -
 110
110 -
 111
111 -
 112
112 -
113
-
114
-
115
-
116
-
117
-
118
-
119
-
120
-
121
-
122
-
123
-
124
-
125
-
126
-
127
-
128
-
129
-
130
-
131
-
132
-
133
-
134
-
135
-
136
-
137
-
138
-
139
-
140
-
141
-
142
-
143
-
144
-
145
-
146
-
147
-
148
-
149
-
150
-
151
-
152
-
153
-
154
-
155
-
156
 |
 |

100 Qantas Annual Report 2008
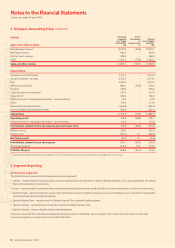
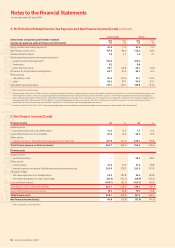
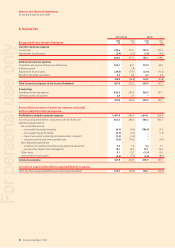
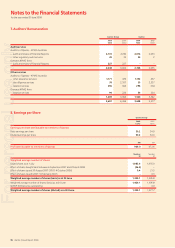
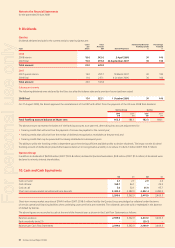
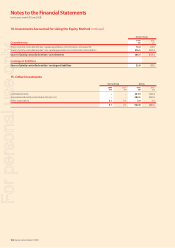
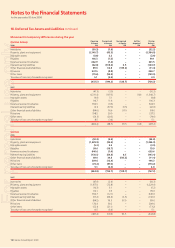
Notes to the Financial Statements
for the year ended 30 June 2008
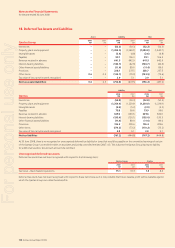
Qantas Group
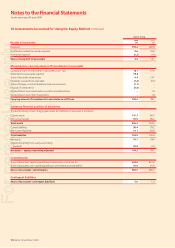
Results of associates 2008
$M
2007
$M
Revenues 194.4 228.8
Profi t before related income tax expense 9.6 16.6
Income tax expense (5.2) (1.9)
Share of net profit of associates 4.4 14.7
Movements in carrying amount of investments in associates
Carrying amount of investments in associates as at 1 July 78.1 67.0
Investments in associates acquired 35.4 –
Share of net profi t of associates 4.4 14.7
Dividends received from associates (1.2) (6.0)
Share of foreign currency translation reserve movements (7.1) –
Disposal of investments (0.4) –
Reclassifi cation from investments in jointly controlled entities –1.0
Reclassifi cation from other investments –1.4
Carrying amount of investments in associates as at 30 June 109.2 78.1
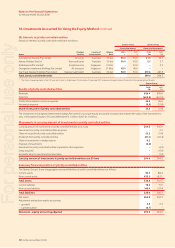
Summary financial position of associates
The Qantas Group’s share of aggregate assets and liabilities of associates is as follows:
Current assets 110.7 96.7
Non-current assets 95.5 98.2
Total assets 206.2 194.9
Current liabilities 98.4 79.2
Non-current liabilities 31.1 40.8
Total liabilities 129.5 120.0
Net assets 76.7 74.9
Adjustment arising from equity accounting
goodwill –32.5 3.2
Net assets – equity accounting adjusted 109.2 78.1
Commitments
Share of associates’ capital expenditure commitments contracted for 934.0 621.0
Share of associates’ non-capital expenditure commitments contracted for 35.9 35.3
Share of associates’ commitments 969.9 656.3
Contingent liabilities
Share of associates’ contingent liabilities 5.0 5.2
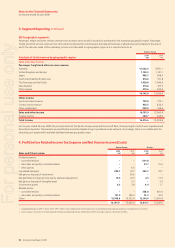
14. Investments Accounted for Using the Equity Method continued
For personal use only