Qantas 2008 Annual Report Download - page 120
Download and view the complete annual report
Please find page 120 of the 2008 Qantas annual report below. You can navigate through the pages in the report by either clicking on the pages listed below, or by using the keyword search tool below to find specific information within the annual report.-
 1
1 -
2
-
3
-
4
-
5
-
6
-
7
-
8
-
9
-
10
-
11
-
12
-
13
-
14
-
15
-
16
-
17
-
18
-
19
-
20
-
21
-
22
-
23
-
24
-
25
-
26
-
27
-
28
-
29
-
30
-
31
-
32
-
33
-
34
-
35
-
36
-
37
-
38
-
39
-
40
-
41
-
42
-
43
-
44
-
45
-
46
-
47
-
48
-
49
-
50
-
51
-
52
-
53
-
54
-
55
-
56
-
57
-
58
-
59
-
60
-
61
-
62
-
63
-
64
-
65
-
66
-
67
-
68
-
69
-
70
-
71
-
72
-
73
-
74
-
75
-
76
-
77
-
78
-
79
-
80
-
81
-
82
-
83
-
84
-
85
-
86
-
87
-
88
-
89
-
90
-
91
-
92
-
93
-
94
-
95
-
96
-
97
-
98
-
99
-
100
-
101
-
102
-
103
-
104
-
105
-
106
-
107
-
108
-
109
-
 110
110 -
 111
111 -
 112
112 -
 113
113 -
 114
114 -
 115
115 -
 116
116 -
 117
117 -
 118
118 -
 119
119 -
 120
120 -
 121
121 -
 122
122 -
 123
123 -
 124
124 -
 125
125 -
 126
126 -
 127
127 -
 128
128 -
 129
129 -
 130
130 -
131
-
132
-
133
-
134
-
135
-
136
-
137
-
138
-
139
-
140
-
141
-
142
-
143
-
144
-
145
-
146
-
147
-
148
-
149
-
150
-
151
-
152
-
153
-
154
-
155
-
156
 |
 |
118 Qantas Annual Report 2008
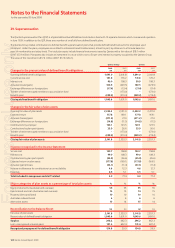
Notes to the Financial Statements
for the year ended 30 June 2008
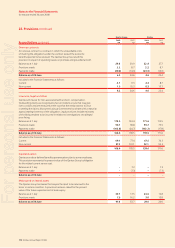
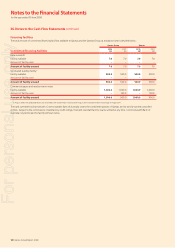
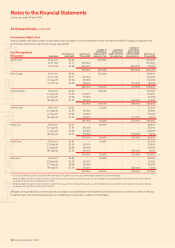
To the extent that the hedges were assessed as highly effective, the effective portion of changes in fair value are included in the hedge reserve.
For further information on accounting for derivative fi nancial instruments as cash fl ow hedges, see Note 1(F). The periods in which the related
cash fl ows are expected to occur are summarised below:
Qantas Group Qantas
Contracts to hedge
2008
Less than
1 Year
$M
1 to 5 Years
$M
More than
5 Years
$M
Total
$M
Less than
1 Year
$M
1 to 5 Years
$M
More than
5 Years
$M
Total
$M
Future foreign currency receipts and payments (18.5) 295.5 13.3 290.3 (17.4) 295.5 13.3 291.4
Future aviation fuel payments 653.1 108.2 – 761.3 653.1 108.2 – 761.3
Future interest payments 21.2 38.9 2.1 62.2 21.3 38.9 2.0 62.2
Future capital expenditure payments (389.5) (123.0) – (512.5) (389.5) (123.0) – (512.5)
266.3 319.6 15.4 601.3 267.5 319.6 15.3 602.4
Related deferred tax (expense)/benefi t (180.4) (180.7)
Total net gain included within hedge reserve 420.9 421.7
2007
Future foreign currency receipts and payments (12.3) 186.3 158.1 332.1 (10.1) 186.3 158.1 334.3
Future aviation fuel payments 46.8 6.6 – 53.4 46.8 6.6 – 53.4
Future interest payments 31.8 15.4 10.8 58.0 31.8 15.4 10.8 58.0
Future capital expenditure payments (70.0) (202.1) – (272.1) (70.0) (202.1) – (272.1)
(3.7) 6.2 168.9 171.4 (1.5) 6.2 168.9 173.6
Related deferred tax (expense)/benefi t(51.4)(52.0)
Total net gain included within hedge reserve 120.0 121.6
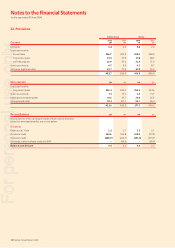
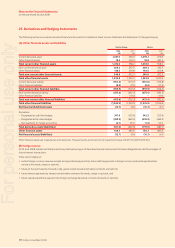
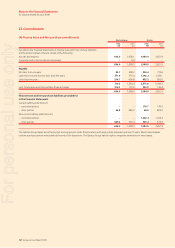
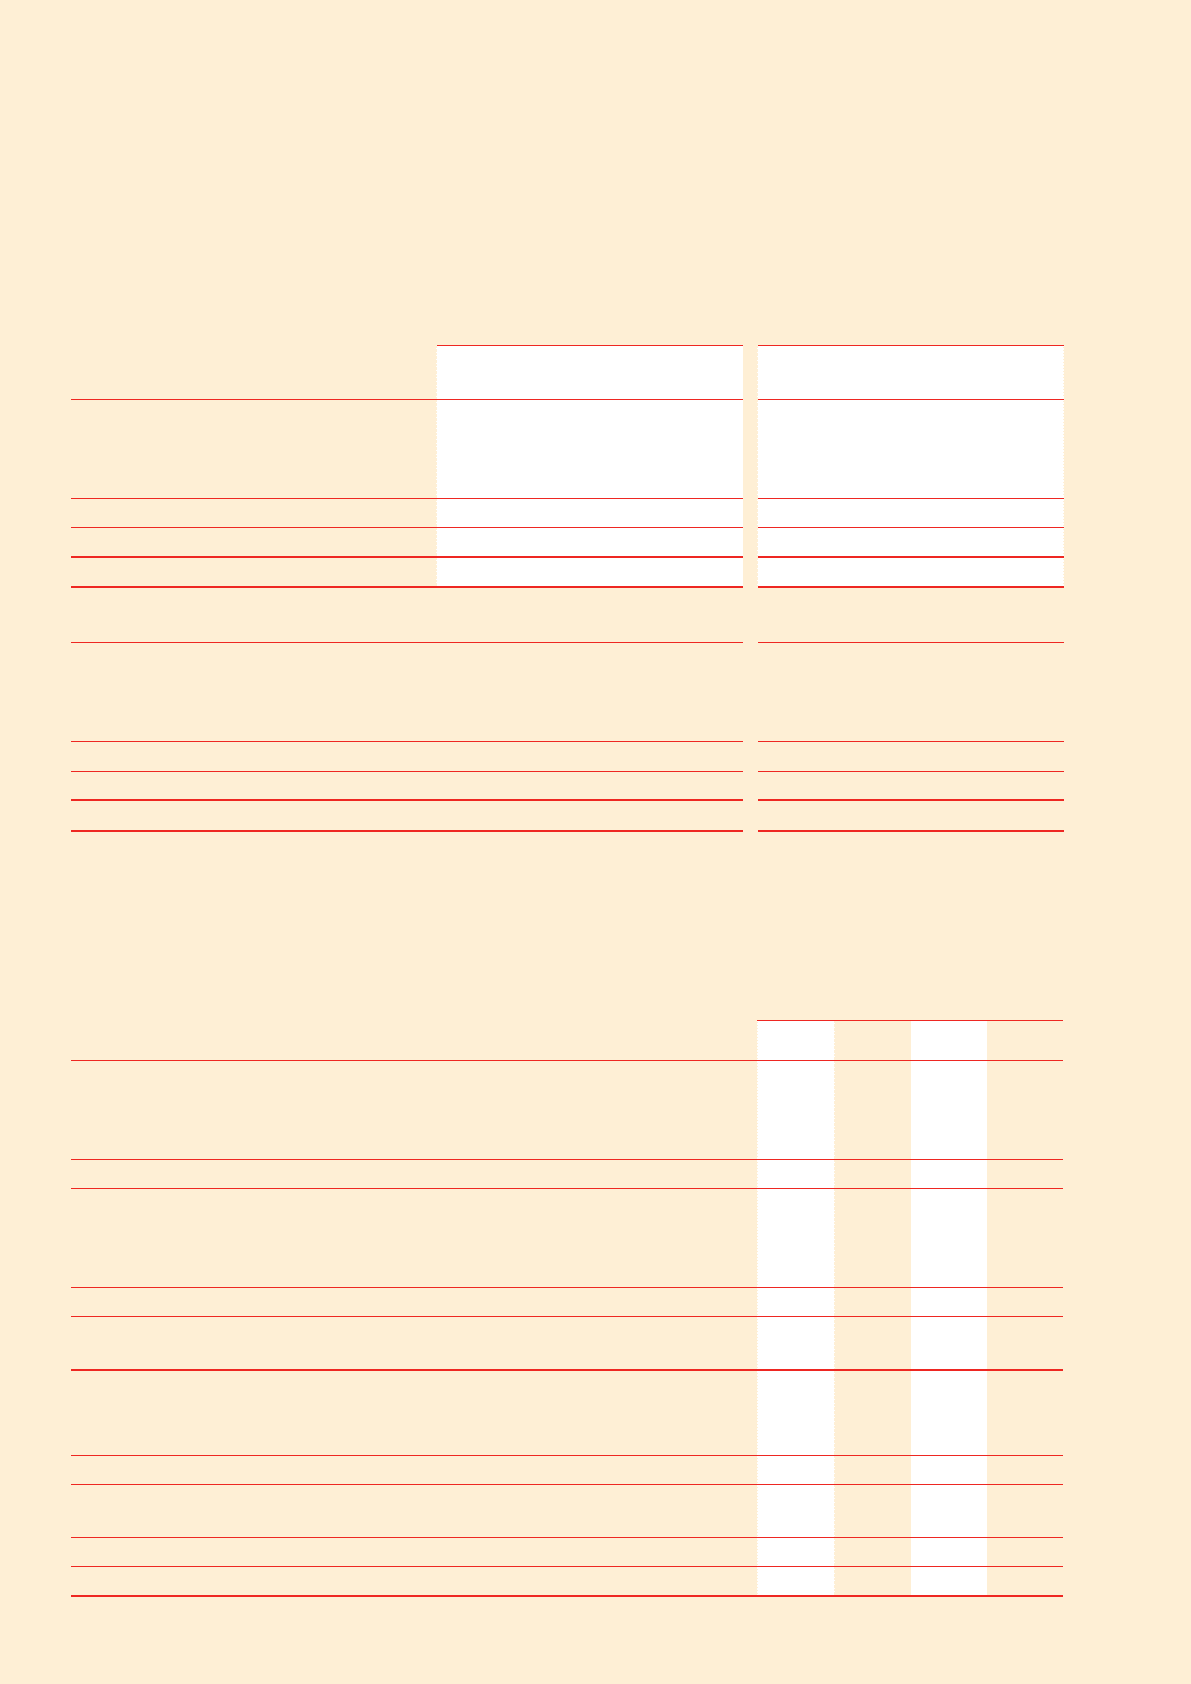
(C) Derivative ineffectiveness and non-designated derivatives in Income Statement
Amounts shown below refl ect ineffectiveness on changes in the fair value of any derivative instrument, or part of a derivative instrument that does
not qualify for hedge accounting. AASB 139 Financial Instruments: Recognition and Measurement (AASB 139) also permits reporting entities
to separate the intrinsic value and time value of an option. AASB 139 only allows for the intrinsic value of an option to be designated as part
of any hedging relationship. As a result, the time value component is not hedge accounted and changes in fair values are recognised immediately
in the Income Statement for the fi nancial period as it does not form part of a hedging relationship.
Qantas Group Qantas
Ineffective and non-designated derivatives 2008
$M
2007
$M
2008
$M
2007
$M
Ineffective derivatives
Ineffective portion from cash fl ow hedges 74.3 (41.1) 74.3 (41.1)
Non-designated derivatives
Component of derivatives not hedge accounted (including time value of options) (31.5) 108.7 (31.5) 108.7
Total closed positions – (gain)/loss 42.8 67.6 42.8 67.6
Ineffective derivatives
Ineffective portion from cash fl ow hedges 79.9 (55.3) 79.9 (55.3)
Non-designated derivatives
Component of derivatives not hedge accounted (including time value of options) (67.6) 109.4 (67.6) 109.4
Total open positions – (gain)/loss 12.3 54.1 12.3 54.1
Total ineffectiveness from cash flow hedges and non-designated
derivatives – (gain)/loss 55.1 121.7 55.1 121.7
Fair value hedges
Gain/(loss) on adjustments for hedged item on foreign exchange risk 118.6 224.1 118.6 224.1
Gain/(loss) on adjustments for hedged item on interest rate risk (83.1) (36.3) (83.1) (36.3)
Total gain/(loss) on adjustments for hedged item designated in fair value hedges 35.5 187.8 35.5 187.8
Gains /(loss) on derivative designated as fair value hedge on foreign exchange risk (118.6) (224.1) (118.6) (224.1)
Gains /(loss) on derivative designated as fair value hedge on interest rate risk 79.7 31.9 79.7 31.9
Total gain/(loss) on derivative designated as fair value hedges (38.9) (192.2) (38.9) (192.2)
Total ineffectiveness from fair value hedges in net finance income/(costs) (3.4) (4.4) (3.4) (4.4)
25. Derivatives and Hedging Instruments continued
For personal use only