Qantas 2008 Annual Report Download - page 77
Download and view the complete annual report
Please find page 77 of the 2008 Qantas annual report below. You can navigate through the pages in the report by either clicking on the pages listed below, or by using the keyword search tool below to find specific information within the annual report.-
 1
1 -
2
-
3
-
4
-
5
-
6
-
7
-
8
-
9
-
10
-
11
-
12
-
13
-
14
-
15
-
16
-
17
-
18
-
19
-
20
-
21
-
22
-
23
-
24
-
25
-
26
-
27
-
28
-
29
-
30
-
31
-
32
-
33
-
34
-
35
-
36
-
37
-
38
-
39
-
40
-
41
-
42
-
43
-
44
-
45
-
46
-
47
-
48
-
49
-
50
-
51
-
52
-
53
-
54
-
55
-
56
-
57
-
58
-
59
-
60
-
61
-
62
-
63
-
64
-
65
-
66
-
 67
67 -
 68
68 -
 69
69 -
 70
70 -
 71
71 -
 72
72 -
 73
73 -
 74
74 -
 75
75 -
 76
76 -
 77
77 -
 78
78 -
 79
79 -
 80
80 -
 81
81 -
 82
82 -
 83
83 -
 84
84 -
 85
85 -
 86
86 -
 87
87 -
88
-
89
-
90
-
91
-
92
-
93
-
94
-
95
-
96
-
97
-
98
-
99
-
100
-
101
-
102
-
103
-
104
-
105
-
106
-
107
-
108
-
109
-
110
-
111
-
112
-
113
-
114
-
115
-
116
-
117
-
118
-
119
-
120
-
121
-
122
-
123
-
124
-
125
-
126
-
127
-
128
-
129
-
130
-
131
-
132
-
133
-
134
-
135
-
136
-
137
-
138
-
139
-
140
-
141
-
142
-
143
-
144
-
145
-
146
-
147
-
148
-
149
-
150
-
151
-
152
-
153
-
154
-
155
-
156
 |
 |

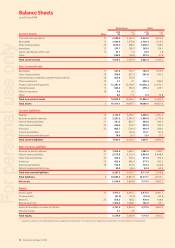
75 Qantas Annual Report 2008
Qantas Group Qantas
Current Assets Notes
2008
$M
20071
$M
2008
$M
20071
$M
Cash and cash equivalents 10 2,599.0 3,362.9 2,461.0 3,409.3
Receivables 11 1,434.9 1,376.8 2,705.3 1,214.0
Other fi nancial assets 25 1,076.0 558.2 1,078.0 558.2
Inventories 12 215.7 180.3 163.0 124.1
Assets classifi ed as held for sale 13 41.1 5.4 27.6 1.8
Other 249.5 103.8 227.5 91.8
Total current assets 5,616.2 5,587.4 6,662.4 5,399.2
Non-current Assets
Receivables 11 531.8 372.7 784.9 1,155.9
Other fi nancial assets 25 346.8 472.3 346.8 472.3
Investments accounted for using the equity method 14 403.8 372.6 ––
Other investments 15 3.1 3.1 552.8 580.0
Property, plant and equipment 16 12,341.0 12,308.3 10,834.2 10,970.1
Intangible assets 17 448.4 365.9 299.2 233.1
Deferred tax assets 18 0.6 0.3 ––
Other 8.4 11.1 8.3 10.8
Total non-current assets 14,083.9 13,906.3 12,826.2 13,422.2
Total assets 319,700.1 19,493.7 19,488.6 18,821.4
Current Liabilities
Payables 19 2,173.9 2,005.7 2,598.6 2,207.5
Revenue received in advance 20 3,267.2 3,049.3 2,894.6 2,775.4
Interest-bearing liabilities 21 587.2 863.7 664.0 920.0
Other fi nancial liabilities 25 959.9 337.2 959.9 334.3
Provisions 22 483.7 500.4 416.9 436.0
Current tax liabilities 113.1 153.6 110.7 151.6
Deferred lease benefi ts/income 18.9 29.3 15.0 25.5
Total current liabilities 7,603.9 6,939.2 7,659.7 6,850.3
Non-current Liabilities
Revenue received in advance 20 1,082.6 1,049.7 1,082.6 1,049.7
Interest-bearing liabilities 21 3,572.8 4,210.9 3,963.9 4,648.4
Other fi nancial liabilities 25 475.6 702.3 475.6 702.3
Provisions 22 423.6 445.3 377.3 403.2
Deferred tax liabilities 18 756.8 437.5 767.2 444.8
Deferred lease benefi ts/income 49.9 69.0 44.8 60.4
Total non-current liabilities 6,361.3 6,914.7 6,711.4 7,30 8.8
Total liabilities 313,965.2 13,853.9 14,371.1 14,159.1
Net assets 5,734.9 5,639.8 5,117.5 4,662.3
Equity
Issued capital 23 3,975.5 4,481.2 3,975.5 4,481.2
Treasury shares (61.0) (32.6) (61.0) (32.6)
Reserves 23 454.3 148.2 474.4 148.6
Retained earnings 1,362.4 1,038.1 728.6 65.1
Equity attributable to members of Qantas 5,731.2 5,634.9 5,117.5 4,662.3
Minority interest 3.7 4.9 ––
Total equity 5,734.9 5,639.8 5,117.5 4,662.3
Comparatives have been restated following the early adoption of Interpretation 13 Customer Loyalty Programmes (Interpretation 13). Refer to Note 2 for further details.
1
Balance Sheets
as at 30 June 2008
For personal use only