Proctor and Gamble 2012 Annual Report Download - page 76
Download and view the complete annual report
Please find page 76 of the 2012 Proctor and Gamble annual report below. You can navigate through the pages in the report by either clicking on the pages listed below, or by using the keyword search tool below to find specific information within the annual report.-
 1
1 -
2
-
3
-
4
-
5
-
6
-
7
-
8
-
9
-
10
-
11
-
12
-
13
-
14
-
15
-
16
-
17
-
18
-
19
-
20
-
21
-
22
-
23
-
24
-
25
-
26
-
27
-
28
-
29
-
30
-
31
-
32
-
33
-
34
-
35
-
36
-
37
-
38
-
39
-
40
-
41
-
42
-
43
-
44
-
45
-
46
-
47
-
48
-
49
-
50
-
51
-
52
-
53
-
54
-
55
-
56
-
57
-
58
-
59
-
60
-
61
-
62
-
63
-
64
-
65
-
 66
66 -
 67
67 -
 68
68 -
 69
69 -
 70
70 -
 71
71 -
 72
72 -
 73
73 -
 74
74 -
 75
75 -
 76
76 -
 77
77 -
 78
78 -
 79
79 -
 80
80 -
 81
81 -
 82
82 -
 83
83 -
 84
84 -
 85
85 -
 86
86 -
87
-
88
-
89
-
90
-
91
-
92
 |
 |
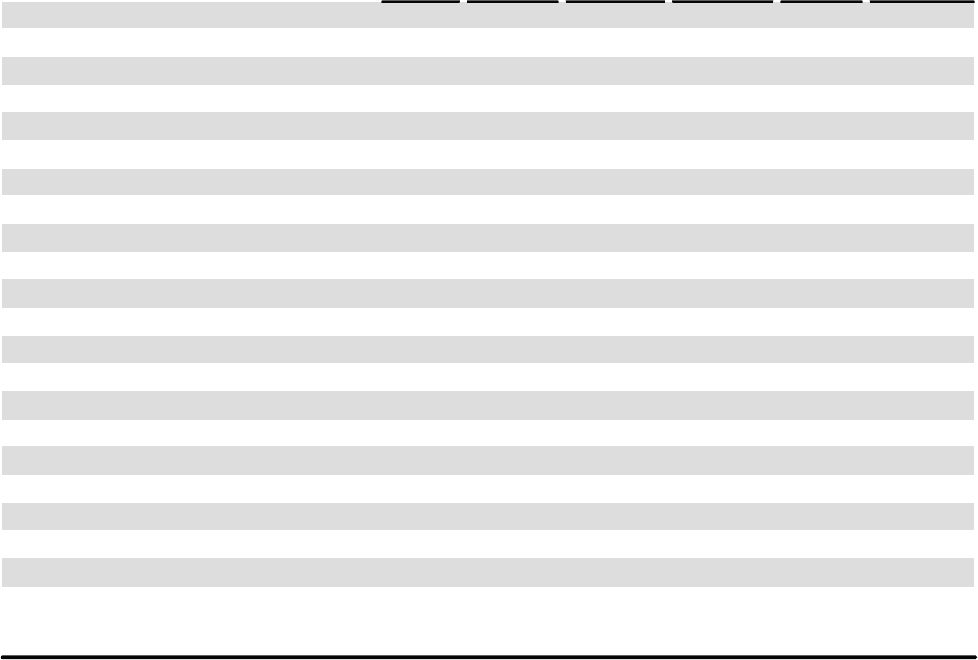
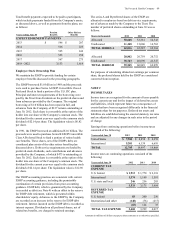
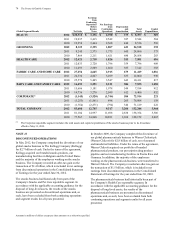
74 The Procter & Gamble Company
Amounts in millions of dollars except per share amounts or as otherwise specified.
Global Segment Results Net Sales
Earnings
from
Continuing
Operations
Before
Income
Taxes
Net Earnings
from
Continuing
Operations
Depreciation
and
Amortization
Total
Assets
Capital
Expenditures
BEAUTY 2012 $ 20,318 $ 3,196 $ 2,390 $ 379 $ 8,357 $ 569
2011 19,937 3,415 2,542 387 9,544 504
2010 19,258 3,444 2,568 448 8,516 510
GROOMING 2012 8,339 2,395 1,807 623 24,518 392
2011 8,245 2,375 1,775 645 24,866 373
2010 7,864 2,211 1,621 680 24,568 283
HEALTH CARE 2012 12,421 2,718 1,826 353 7,501 496
2011 12,033 2,720 1,796 359 7,796 409
2010 11,493 2,809 1,860 385 7,142 383
FABRIC CARE AND HOME CARE 2012 27,254 4,645 2,915 679 11,419 1,036
2011 26,536 4,867 3,109 633 12,060 950
2010 25,570 5,405 3,547 643 10,411 817
BABY CARE AND FAMILY CARE 2012 16,493 3,351 2,123 586 7,535 1,250
2011 15,606 3,181 1,978 549 7,184 912
2010 14,736 3,270 2,049 612 6,406 852
CORPORATE(1) 2012 (1,145) (3,520)(1,744) 584 72,914 221
2011 (1,253) (1,561) 498 265 76,904 158
2010 (1,354) (2,271)(794) 340 71,129 222
TOTAL COMPANY 2012 83,680 12,785 9,317 3,204 132,244 3,964
2011 81,104 14,997 11,698 2,838 138,354 3,306
2010 77,567 14,868 10,851 3,108 128,172 3,067
(1) The Corporate reportable segment includes the total assets and capital expenditures of the snacks business prior to its divestiture
effective May 31, 2012.
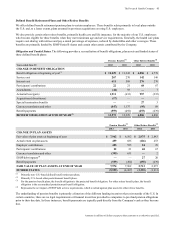
NOTE 12
DISCONTINUED OPERATIONS
In May 2012, the Company completed the divestiture of our
global snacks business to The Kellogg Company (Kellogg)
for $2.7 billion of cash. Under the terms of the agreement,
Kellogg acquired our branded snacks products, our
manufacturing facilities in Belgium and the United States
and the majority of the employees working on the snacks
business. The Company recorded an after-tax gain on the
transaction of $1.4 billion, which is included in net earnings
from discontinued operations in the Consolidated Statement
of Earnings for the year ended June 30, 2012.
The snacks business had historically been part of the
Company's Snacks and Pet Care reportable segment. In
accordance with the applicable accounting guidance for the
disposal of long-lived assets, the results of the snacks
business are presented as discontinued operations and, as
such, have been excluded from both continuing operations
and segment results for all years presented.
In October 2009, the Company completed the divestiture of
our global pharmaceuticals business to Warner Chilcott plc
(Warner Chilcott) for $2.8 billion of cash, net of assumed
and transferred liabilities. Under the terms of the agreement,
Warner Chilcott acquired our portfolio of branded
pharmaceutical products, our prescription drug product
pipeline and our manufacturing facilities in Puerto Rico and
Germany. In addition, the majority of the employees
working on the pharmaceuticals business were transferred to
Warner Chilcott. The Company recorded an after-tax gain on
the transaction of $1.5 billion, which is included in net
earnings from discontinued operations in the Consolidated
Statement of Earnings for the year ended June 30, 2010.
The pharmaceuticals business had historically been part of
the Company's Health Care reportable segment. In
accordance with the applicable accounting guidance for the
disposal of long-lived assets, the results of the
pharmaceuticals business are presented as discontinued
operations and, as such, have been excluded from both
continuing operations and segment results for all years
presented.