Proctor and Gamble 2012 Annual Report Download - page 24
Download and view the complete annual report
Please find page 24 of the 2012 Proctor and Gamble annual report below. You can navigate through the pages in the report by either clicking on the pages listed below, or by using the keyword search tool below to find specific information within the annual report.-
 1
1 -
2
-
3
-
4
-
5
-
6
-
7
-
8
-
9
-
10
-
11
-
12
-
13
-
 14
14 -
 15
15 -
 16
16 -
 17
17 -
 18
18 -
 19
19 -
 20
20 -
 21
21 -
 22
22 -
 23
23 -
 24
24 -
 25
25 -
 26
26 -
 27
27 -
 28
28 -
 29
29 -
 30
30 -
 31
31 -
 32
32 -
 33
33 -
 34
34 -
35
-
36
-
37
-
38
-
39
-
40
-
41
-
42
-
43
-
44
-
45
-
46
-
47
-
48
-
49
-
50
-
51
-
52
-
53
-
54
-
55
-
56
-
57
-
58
-
59
-
60
-
61
-
62
-
63
-
64
-
65
-
66
-
67
-
68
-
69
-
70
-
71
-
72
-
73
-
74
-
75
-
76
-
77
-
78
-
79
-
80
-
81
-
82
-
83
-
84
-
85
-
86
-
87
-
88
-
89
-
90
-
91
-
92
 |
 |
22 The Procter & Gamble Company
PART II
Item 5. Market for Registrant's Common Equity, Related Stockholder Matters and Issuer Purchases of Equity Securities.
ISSUER PURCHASES OF EQUITY SECURITIES
Period
Total Number of
Shares Purchased (1) Average Price
Paid per Share (2)
Total Number of
Shares Purchased as
Part of Publicly
Announced Plans or
Programs (3)
Approximate Dollar Value of
Shares That May Yet be
Purchased Under our Share
Repurchase Program
4/1/2012 - 4/30/2012 235 $66.95 0 0
5/1/2012 - 5/31/2012 0 0 0 0
6/1/2012 - 6/30/2012 0 0 0 0
(1) The total number of shares purchased was 235 for the quarter. This represents shares acquired by the Company under various
compensation and benefit plans. This table excludes shares withheld from employees to satisfy minimum tax withholding
requirements on option exercises and other equity-based transactions. The Company administers cashless exercises through an
independent, third party broker and does not repurchase stock in connection with cashless exercise.
(2) Average price paid per share is calculated on a settlement basis and excludes commission.
(3) On April 27, 2012, the Company stated that fiscal year 2011-12 share repurchases were estimated to be approximately $4.0 billion,
notwithstanding any purchases under the Company's compensation and benefit plans. The share repurchases were authorized pursuant
to a resolution issued by the Company's Board of Directors and were financed by issuing a combination of long-term and short-term
debt. The total dollar value of shares purchased under the share repurchase plan was $4.0 billion. The share repurchase plan expired
on June 30, 2012.
Additional information required by this item can be found in Part III, Item 12 of this Form 10-K.
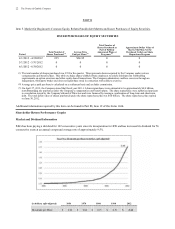
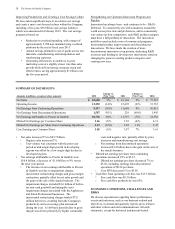
Shareholder Return Performance Graphs
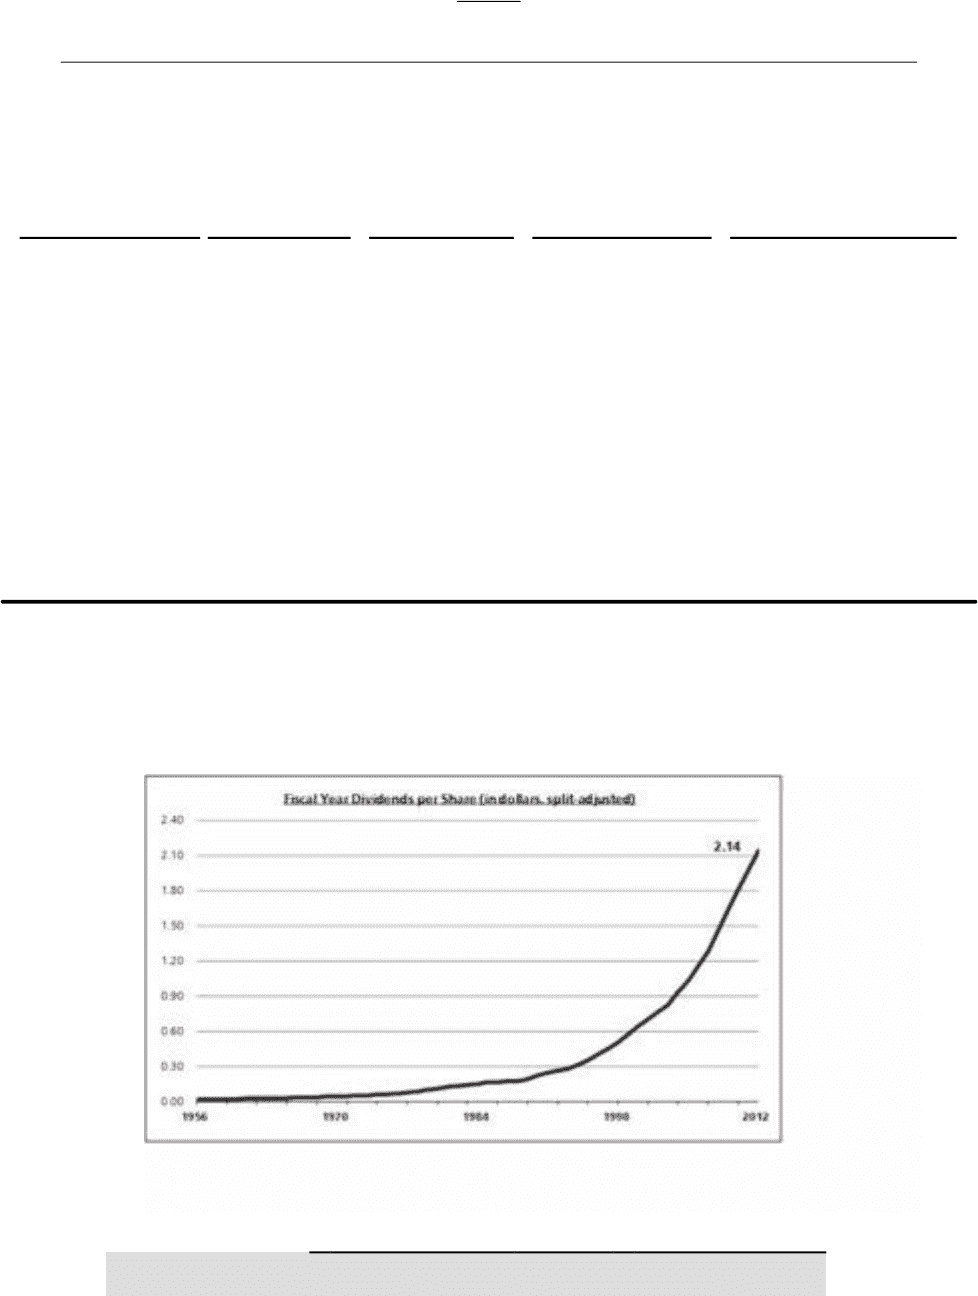
Market and Dividend Information
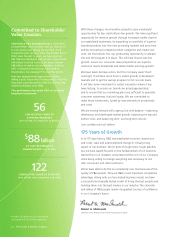
P&G has been paying a dividend for 122 consecutive years since its incorporation in 1890 and has increased its dividend for 56
consecutive years at an annual compound average rate of approximately 9.5%.
(in dollars; split-adjusted) 1956 1970 1984 1998 2012
Dividends per Share $ 0.01 $ 0.04 $ 0.15 $ 0.51 $ 2.14