Proctor and Gamble 2012 Annual Report Download - page 5
Download and view the complete annual report
Please find page 5 of the 2012 Proctor and Gamble annual report below. You can navigate through the pages in the report by either clicking on the pages listed below, or by using the keyword search tool below to find specific information within the annual report.-
 1
1 -
 2
2 -
 3
3 -
 4
4 -
 5
5 -
 6
6 -
 7
7 -
 8
8 -
 9
9 -
 10
10 -
 11
11 -
 12
12 -
 13
13 -
 14
14 -
 15
15 -
 16
16 -
17
-
18
-
19
-
20
-
21
-
22
-
23
-
24
-
25
-
26
-
27
-
28
-
29
-
30
-
31
-
32
-
33
-
34
-
35
-
36
-
37
-
38
-
39
-
40
-
41
-
42
-
43
-
44
-
45
-
46
-
47
-
48
-
49
-
50
-
51
-
52
-
53
-
54
-
55
-
56
-
57
-
58
-
59
-
60
-
61
-
62
-
63
-
64
-
65
-
66
-
67
-
68
-
69
-
70
-
71
-
72
-
73
-
74
-
75
-
76
-
77
-
78
-
79
-
80
-
81
-
82
-
83
-
84
-
85
-
86
-
87
-
88
-
89
-
90
-
91
-
92
 |
 |

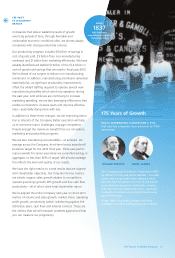
The model works. Funding it with productivity savings and executing
it broadly and consistently with discipline is the proven way for
P&G to deliver the business and fi nancial results to which we’ve
committed. This is what we are doing.
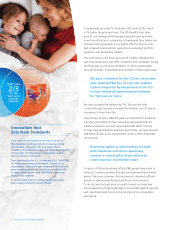
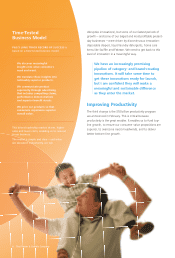
Fiscal Year Financial Results
Developing-market organic sales growth and cash fl ow productivity
were both strong in . Developed-market organic sales growth
and earnings progress were not.
In fi scal , we delivered % organic
sales growth overall. P&G has averaged
% organic sales growth over the past
three years, achieving % to % organic
sales growth for consecutive quarters.
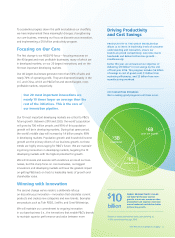
In just three years, we’ve added organic sales of $. billion,
the equivalent of adding a Fortune company to our portfolio.
Growth continues to be very strong in developing markets, which
now generate % of P&G’s sales and % of our unit volume.
It’s a $ billion business for P&G, the largest developing-market
business of any consumer products company. We see signifi cant
remaining growth opportunities as our business in developing
markets is still smaller as a percent of sales than the developing
market businesses of some of our competitors, and we will continue
to focus on growing our business in the largest and most important
of these markets.
Our growth in developed markets has been weaker, resulting from
slower market growth and declining market shares. The share
declines in these markets were driven primarily by consumer value
issues on key brands in several large categories due to a combina-
tion of price increases taken to recover higher commodity costs,
which our competitors did not take, and increased promotional
activity by competitors. Developed markets represent about %
of our sales and % of operating profi ts, so it’s essential that
they are healthy and growing. Consequently, developed-market
businesses
—
including fabric care and baby care in the United States
and the largest markets in Western Europe, as well as the United
States oral care, skin care, hair care, shave care and feminine care
categories
—
are a disproportionate focus of strengthened plans
that we began to implement earlier this year. We are ensuring we
have product offerings from each of these businesses that provide
superior value
—
at the right price and with innovation that is
strong
—
supported by marketing that effectively communicates the
superiority of our products.
*
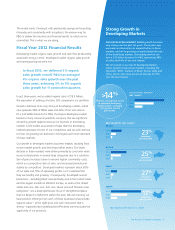
Strong Growth in
Developing Markets
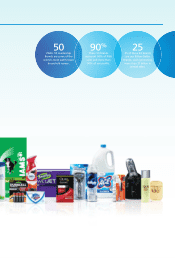
OUR DEVELOPING-MARKET SALES growth has been
very strong over the past ten years. Three years ago,
we made an intervention to expand further in these
markets, and we’re growing at nearly double the rate
of the underlying markets. Developing markets are
now a $ billion business for P&G, generating %
of sales and % of our unit volume.
We’re focused on our top developing markets
where growth prospects are highest, including the
important “BRIC” markets of Brazil, Russia, India and
China, where sales have grown an average of %
over the past decade.
>
%
P&G has a strong track record
of successful developing-
market growth
—
averaging
>% growth over the
pastdecade.
%
compound
annual growth
%
compound
annual growth
%
compound
annual growth
*
%
compound
annual growth
* Bars represent net sales in U.S. dollars.
The Procter & Gamble Company 3