Proctor and Gamble 2012 Annual Report Download - page 26
Download and view the complete annual report
Please find page 26 of the 2012 Proctor and Gamble annual report below. You can navigate through the pages in the report by either clicking on the pages listed below, or by using the keyword search tool below to find specific information within the annual report.-
 1
1 -
2
-
3
-
4
-
5
-
6
-
7
-
8
-
9
-
10
-
11
-
12
-
13
-
14
-
15
-
 16
16 -
 17
17 -
 18
18 -
 19
19 -
 20
20 -
 21
21 -
 22
22 -
 23
23 -
 24
24 -
 25
25 -
 26
26 -
 27
27 -
 28
28 -
 29
29 -
 30
30 -
 31
31 -
 32
32 -
 33
33 -
 34
34 -
 35
35 -
 36
36 -
37
-
38
-
39
-
40
-
41
-
42
-
43
-
44
-
45
-
46
-
47
-
48
-
49
-
50
-
51
-
52
-
53
-
54
-
55
-
56
-
57
-
58
-
59
-
60
-
61
-
62
-
63
-
64
-
65
-
66
-
67
-
68
-
69
-
70
-
71
-
72
-
73
-
74
-
75
-
76
-
77
-
78
-
79
-
80
-
81
-
82
-
83
-
84
-
85
-
86
-
87
-
88
-
89
-
90
-
91
-
92
 |
 |

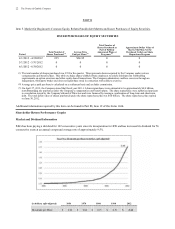
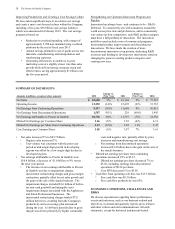
24 The Procter & Gamble Company
Item 6. Selected Financial Data.
The information required by this item is incorporated by reference to Note 1 of our Consolidated Financial Statements,
Summary of Significant Accounting Policies and Note 11 of our Consolidated Financial Statements, Segment Information.
Financial Summary (Unaudited)
Amounts in millions, except per share amounts 2012 2011 2010 2009 2008 2007
Net Sales $ 83,680 $ 81,104 $ 77,567 $ 75,295 $ 77,714 $ 71,095
Gross Profit 41,289 41,245 40,525 37,644 39,534 36,607
Operating Income 13,292 15,495 15,732 15,188 15,743 14,236
Net Earnings from Continuing Operations 9,317 11,698 10,851 10,645 11,224 9,562
Net Earnings from Discontinued Operations 1,587 229 1,995 2,877 930 847
Net Earnings attributable to Procter & Gamble 10,756 11,797 12,736 13,436 12,075 10,340
Net Earnings Margin from Continuing
Operations 11.1% 14.4% 14.0% 14.1% 14.4% 13.4%
Basic Net Earnings per Common Share (1):
Earnings from continuing operations $ 3.24 $ 4.04 $ 3.63 $ 3.51 $ 3.56 $ 2.95
Earnings from discontinued operations 0.58 0.08 0.69 0.98 0.30 0.27
Basic Net Earnings per Common Share 3.82 4.12 4.32 4.49 3.86 3.22
Diluted Net Earnings per Common Share (1):
Earnings from continuing operations 3.12 3.85 3.47 3.35 3.36 2.79
Earnings from discontinued operations 0.54 0.08 0.64 0.91 0.28 0.25
Diluted Net Earnings per Common Share 3.66 3.93 4.11 4.26 3.64 3.04
Dividends per Common Share 2.14 1.97 1.80 1.64 1.45 1.28
Research and Development Expense $ 2,029 $ 1,982 $ 1,931 $ 1,844 $ 1,927 $ 1,809
Advertising Expense 9,345 9,210 8,475 7,453 8,426 7,714
Total Assets 132,244 138,354 128,172 134,833 143,992 138,014
Capital Expenditures 3,964 3,306 3,067 3,238 3,046 2,945
Long-Term Debt 21,080 22,033 21,360 20,652 23,581 23,375
Shareholders' Equity 64,035 68,001 61,439 63,382 69,784 67,012
(1) Basic net earnings per share and diluted net earnings per share are calculated based on net earnings attributable to Procter & Gamble.