Proctor and Gamble 2012 Annual Report Download - page 67
Download and view the complete annual report
Please find page 67 of the 2012 Proctor and Gamble annual report below. You can navigate through the pages in the report by either clicking on the pages listed below, or by using the keyword search tool below to find specific information within the annual report.-
 1
1 -
2
-
3
-
4
-
5
-
6
-
7
-
8
-
9
-
10
-
11
-
12
-
13
-
14
-
15
-
16
-
17
-
18
-
19
-
20
-
21
-
22
-
23
-
24
-
25
-
26
-
27
-
28
-
29
-
30
-
31
-
32
-
33
-
34
-
35
-
36
-
37
-
38
-
39
-
40
-
41
-
42
-
43
-
44
-
45
-
46
-
47
-
48
-
49
-
50
-
51
-
52
-
53
-
54
-
55
-
56
-
 57
57 -
 58
58 -
 59
59 -
 60
60 -
 61
61 -
 62
62 -
 63
63 -
 64
64 -
 65
65 -
 66
66 -
 67
67 -
 68
68 -
 69
69 -
 70
70 -
 71
71 -
 72
72 -
 73
73 -
 74
74 -
 75
75 -
 76
76 -
 77
77 -
78
-
79
-
80
-
81
-
82
-
83
-
84
-
85
-
86
-
87
-
88
-
89
-
90
-
91
-
92
 |
 |

The Procter & Gamble Company 65
Amounts in millions of dollars except per share amounts or as otherwise specified.
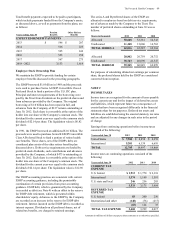
Defined Benefit Retirement Plans and Other Retiree Benefits
We offer defined benefit retirement pension plans to certain employees. These benefits relate primarily to local plans outside
the U.S. and, to a lesser extent, plans assumed in previous acquisitions covering U.S. employees.
We also provide certain other retiree benefits, primarily health care and life insurance, for the majority of our U.S. employees
who become eligible for these benefits when they meet minimum age and service requirements. Generally, the health care plans
require cost sharing with retirees and pay a stated percentage of expenses, reduced by deductibles and other coverages. These
benefits are primarily funded by ESOP Series B shares and certain other assets contributed by the Company.
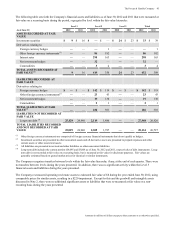
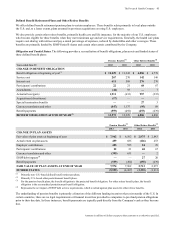
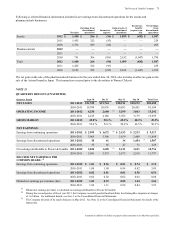
Obligation and Funded Status.The following provides a reconciliation of benefit obligations, plan assets and funded status of
these defined benefit plans:
Pension Benefits(1) Other Retiree Benefits(2)
Years ended June 30 2012 2011 2012 2011
CHANGE IN BENEFIT OBLIGATION
Benefit obligation at beginning of year(3) $ 12,229 $ 11,245 $ 4,886 $ 4,778
Service cost 267 270 142 146
Interest cost 611 588 276 270
Participants' contributions 22 21 68 67
Amendments (44)93 —7
Actuarial loss/(gain) 1,911 (633)957 (235)
Acquisitions/(divestitures) (17)———
Special termination benefits ——27 3
Currency translation and other (847)1,137 (95)89
Benefit payments (559)(492)(255)(239)
BENEFIT OBLIGATION AT END OF YEAR(3) 13,573 12,229 6,006 4,886
Pension Benefits(1) Other Retiree Benefits(2)
2012 2011 2012 2011
CHANGE IN PLAN ASSETS
Fair value of plan assets at beginning of year $ 7,962 $ 6,562 $ 2,975 $ 2,843
Actual return on plan assets 459 685 (126)253
Employer contributions 485 555 24 29
Participants' contributions 22 21 68 67
Currency translation and other (395)631 —2
ESOP debt impacts(4) ——27 20
Benefit payments (559)(492)(255)(239)
FAIR VALUE OF PLAN ASSETS AT END OF YEAR 7,974 7,962 2,713 2,975
FUNDED STATUS (5,599)(4,267)(3,293)(1,911)
(1) Primarily non-U.S.-based defined benefit retirement plans.
(2) Primarily U.S.-based other postretirement benefit plans.
(3) For the pension benefit plans, the benefit obligation is the projected benefit obligation. For other retiree benefit plans, the benefit
obligation is the accumulated postretirement benefit obligation.
(4) Represents the net impact of ESOP debt service requirements, which is netted against plan assets for other retiree benefits.
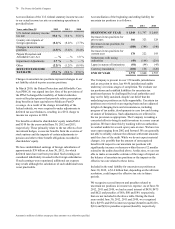
The underfunding of pension benefits is primarily a function of the different funding incentives that exist outside of the U.S. In
certain countries, there are no legal requirements or financial incentives provided to companies to pre-fund pension obligations
prior to their due date. In these instances, benefit payments are typically paid directly from the Company's cash as they become
due.