Proctor and Gamble 2012 Annual Report Download - page 51
Download and view the complete annual report
Please find page 51 of the 2012 Proctor and Gamble annual report below. You can navigate through the pages in the report by either clicking on the pages listed below, or by using the keyword search tool below to find specific information within the annual report.-
 1
1 -
2
-
3
-
4
-
5
-
6
-
7
-
8
-
9
-
10
-
11
-
12
-
13
-
14
-
15
-
16
-
17
-
18
-
19
-
20
-
21
-
22
-
23
-
24
-
25
-
26
-
27
-
28
-
29
-
30
-
31
-
32
-
33
-
34
-
35
-
36
-
37
-
38
-
39
-
40
-
 41
41 -
 42
42 -
 43
43 -
 44
44 -
 45
45 -
 46
46 -
 47
47 -
 48
48 -
 49
49 -
 50
50 -
 51
51 -
 52
52 -
 53
53 -
 54
54 -
 55
55 -
 56
56 -
 57
57 -
 58
58 -
 59
59 -
 60
60 -
 61
61 -
62
-
63
-
64
-
65
-
66
-
67
-
68
-
69
-
70
-
71
-
72
-
73
-
74
-
75
-
76
-
77
-
78
-
79
-
80
-
81
-
82
-
83
-
84
-
85
-
86
-
87
-
88
-
89
-
90
-
91
-
92
 |
 |

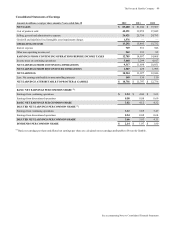
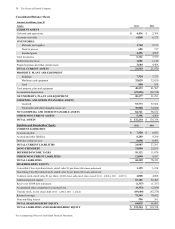
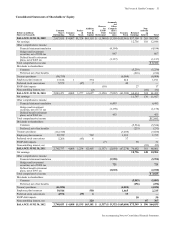
The Procter & Gamble Company 49
See accompanying Notes to Consolidated Financial Statements.
Consolidated Statements of Earnings
Amounts in millions except per share amounts; Years ended June 30 2012 2011 2010
NET SALES $ 83,680 $ 81,104 $ 77,567
Cost of products sold 42,391 39,859 37,042
Selling, general and administrative expense 26,421 25,750 24,793
Goodwill and indefinite lived intangible asset impairment charges 1,576 ——
OPERATING INCOME 13,292 15,495 15,732
Interest expense 769 831 946
Other non-operating income, net 262 333 82
EARNINGS FROM CONTINUING OPERATIONS BEFORE INCOME TAXES 12,785 14,997 14,868
Income taxes on continuing operations 3,468 3,299 4,017
NET EARNINGS FROM CONTINUING OPERATIONS 9,317 11,698 10,851
NET EARNINGS FROM DISCONTINUED OPERATIONS 1,587 229 1,995
NET EARNINGS 10,904 11,927 12,846
Less: Net earnings attributable to noncontrolling interests 148 130 110
NET EARNINGS ATTRIBUTABLE TO PROCTER & GAMBLE $ 10,756 $ 11,797 $ 12,736
BASIC NET EARNINGS PER COMMON SHARE (1):
Earnings from continuing operations $ 3.24 $ 4.04 $ 3.63
Earnings from discontinued operations 0.58 0.08 0.69
BASIC NET EARNINGS PER COMMON SHARE 3.82 4.12 4.32
DILUTED NET EARNINGS PER COMMON SHARE (1):
Earnings from continuing operations 3.12 3.85 3.47
Earnings from discontinued operations 0.54 0.08 0.64
DILUTED NET EARNINGS PER COMMON SHARE 3.66 3.93 4.11
DIVIDENDS PER COMMON SHARE $ 2.14 $ 1.97 $ 1.80
(1) Basic net earnings per share and diluted net earnings per share are calculated on net earnings attributable to Procter & Gamble.