Proctor and Gamble 2012 Annual Report Download - page 13
Download and view the complete annual report
Please find page 13 of the 2012 Proctor and Gamble annual report below. You can navigate through the pages in the report by either clicking on the pages listed below, or by using the keyword search tool below to find specific information within the annual report.-
 1
1 -
2
-
 3
3 -
 4
4 -
 5
5 -
 6
6 -
 7
7 -
 8
8 -
 9
9 -
 10
10 -
 11
11 -
 12
12 -
 13
13 -
 14
14 -
 15
15 -
 16
16 -
 17
17 -
 18
18 -
 19
19 -
 20
20 -
 21
21 -
 22
22 -
 23
23 -
24
-
25
-
26
-
27
-
28
-
29
-
30
-
31
-
32
-
33
-
34
-
35
-
36
-
37
-
38
-
39
-
40
-
41
-
42
-
43
-
44
-
45
-
46
-
47
-
48
-
49
-
50
-
51
-
52
-
53
-
54
-
55
-
56
-
57
-
58
-
59
-
60
-
61
-
62
-
63
-
64
-
65
-
66
-
67
-
68
-
69
-
70
-
71
-
72
-
73
-
74
-
75
-
76
-
77
-
78
-
79
-
80
-
81
-
82
-
83
-
84
-
85
-
86
-
87
-
88
-
89
-
90
-
91
-
92
 |
 |

&’
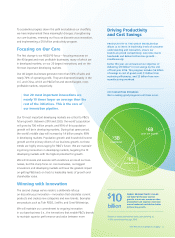
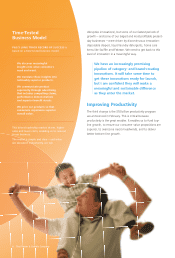
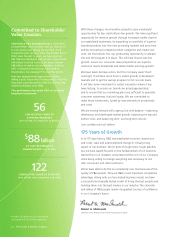
Companies that deliver leadership levels of growth
over long periods of time, through favorable and
unfavorable economic conditions alike, are almost always
companies with strong productivity cultures.
Our productivity program includes $billion of savings in
cost of goods sold, $billion from non-manufacturing
overhead, and $billion from marketing effi ciencies. We have
already identifi ed and staffed $billion of the $.billion in
cost-of-goods-sold savings that we need in fi scal year .
We’re ahead of our targets to reduce non-manufacturing
enrollment. In addition, manufacturing enrollment remained
essentially fl at, as signifi cant productivity improvements
offset the added staffi ng required to operate several new
manufacturing facilities which went into operation during
the past year. And while we are continuing to increase
marketing spending, we are also leveraging effi ciencies that
enable our brands to increase reach and improve effective-
ness
—
essentially doing more with less.
In addition to these three changes, we are improving execu-
tion in all parts of the Company. Better execution will help
us to overcome macro challenges, manage competitive
threats and get the maximum benefi t from our innovation,
marketing and productivity programs.
We are also maintaining accountability
—
at all levels. On
average across the Company, short-term bonus awards will
be below target for the fi scal year. Three-year perfor-
mance awards for senior executives are currently tracking, in
aggregate, to less than % of target. We all acknowledge
this refl ects the level and quality of our results.
We have the right metrics to incent results that are aligned
with shareholder objectives. Our long-term bonus metrics
are simple: organic sales growth relative to competition,
operating earnings growth, EPS growth and free cash fl ow
productivity
—
all of which drive total shareholder return.
We’ve aligned the entire Company next year on short-term
metrics of volume and sales growth, market share, operating
profi t growth, productivity (which is delivering against the
$ billion plan), cash fl ow and internal controls. These are
the metrics that we will measure ourselves against and that
you can measure our progress by.
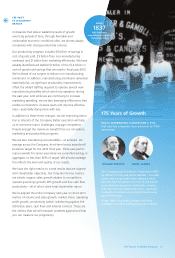
Years of Growth
P&G IS CELEBRATING A MILESTONE in
that very few companies have achieved: its th
anniversary.
The Company was founded in Cincinnati in
by William Procter and James Gamble
—
a candle
maker and a soap maker who started a small
business that has grown into one of the world’s
most admired companies and includes brands
that have become household names, used and
trusted by consumers every day in nearly every
part of the world.
Today, P&G is the world’s largest and most
profi table consumer packaged goods company.
P&G has been
innovating to improve
consumers’ lives
The Procter & Gamble Company 11