Proctor and Gamble 2012 Annual Report Download - page 35
Download and view the complete annual report
Please find page 35 of the 2012 Proctor and Gamble annual report below. You can navigate through the pages in the report by either clicking on the pages listed below, or by using the keyword search tool below to find specific information within the annual report.-
 1
1 -
2
-
3
-
4
-
5
-
6
-
7
-
8
-
9
-
10
-
11
-
12
-
13
-
14
-
15
-
16
-
17
-
18
-
19
-
20
-
21
-
22
-
23
-
24
-
 25
25 -
 26
26 -
 27
27 -
 28
28 -
 29
29 -
 30
30 -
 31
31 -
 32
32 -
 33
33 -
 34
34 -
 35
35 -
 36
36 -
 37
37 -
 38
38 -
 39
39 -
 40
40 -
 41
41 -
 42
42 -
 43
43 -
 44
44 -
 45
45 -
46
-
47
-
48
-
49
-
50
-
51
-
52
-
53
-
54
-
55
-
56
-
57
-
58
-
59
-
60
-
61
-
62
-
63
-
64
-
65
-
66
-
67
-
68
-
69
-
70
-
71
-
72
-
73
-
74
-
75
-
76
-
77
-
78
-
79
-
80
-
81
-
82
-
83
-
84
-
85
-
86
-
87
-
88
-
89
-
90
-
91
-
92
 |
 |
The Procter & Gamble Company 33
Venezuela. Through most of fiscal 2010, payments for
certain imported goods and services that did not qualify for
the official exchange rate had been satisfied by exchanging
Bolivares Fuertes for U.S. dollars through securities
transactions in the parallel market rather than at the more
favorable official exchange rate. In fiscal 2010, the
Venezuelan government enacted regulations that reduced the
availability of foreign currency at the official exchange rate.
That and an increased spread between the official and
parallel exchange rates during most of fiscal 2010 resulted in
increased costs for exchange transactions executed using
securities transactions in the parallel market during fiscal
2010. The parallel market is now controlled by The Central
Bank of Venezuela as the only legal intermediary to execute
foreign exchange transactions outside of CADIVI. This is
done through the SITME rate, which was approximately 5.3
as of June 30, 2012. The notional amount of transactions that
run through this foreign exchange rate for non-essential
goods is restrictive, which has essentially eliminated our
ability to access any foreign exchange rate other than
through the official CADIVI rate to pay for imported goods
and/or manage our local monetary asset balances. Finally,
the Venezuelan government enacted a price control law
during the second half of fiscal 2012 that negatively
impacted the net selling prices of certain products sold in
Venezuela. This impact was not significant for the fiscal
year.
As of June 30, 2012, we had net monetary assets
denominated in local currency of approximately $1.1 billion.
Approximately $338 million of this balance has been
remeasured using the SITME parallel rate because we plan
to use this amount of the net monetary assets (largely cash)
to satisfy U.S. dollar denominated liabilities that do not
qualify for official rate dollars. However, as noted in the
preceding paragraph, the availability of the parallel market
to settle these transactions is uncertain. The remaining net
monetary asset balances are currently reflected within our
Consolidated Financial Statements at the 4.3 official
exchange rate. Depending on the future availability of U.S.
dollars at the official rate, our local U.S. dollar needs, our
overall repatriation plans and the creditworthiness of the
local depository institutions and other creditors, we have
exposure for our local monetary assets. We also have
devaluation exposure for the differential between the current
and potential future official and parallel exchange rates.
Our ability to effectively manage sales and profit levels in
Venezuela will be impacted by several factors. These include
the Company's ability to mitigate the effect of the recently
enacted price controls, any potential future devaluation, any
further Venezuelan government price or exchange controls,
economic conditions and availability of raw materials and
utilities.
SEGMENT RESULTS
Segment results reflect information on the same basis we use
for internal management reporting and performance
evaluation. The results of these reportable segments do not
include certain non-business unit specific costs such as
interest expense, investing activities and certain restructuring
and asset impairment costs. These costs are reported in our
Corporate segment and are included as part of our Corporate
segment discussion. Additionally, as described in Note 11 to
the Consolidated Financial Statements, we have investments
in certain companies over which we exert significant
influence, but do not control the financial and operating
decisions and, therefore, do not consolidate these companies
for U.S. GAAP purposes ("unconsolidated entities"). Given
that certain of these investments are managed as integral
parts of the Company's business units, they are accounted for
as if they were consolidated subsidiaries for management
and segment reporting purposes. This means pre-tax
earnings in the business units include 100% of each pre-tax
income statement component. In determining after-tax
earnings in the business units, we eliminate the share of
earnings applicable to other ownership interests, in a manner
similar to noncontrolling interest, and apply the statutory tax
rates. Eliminations to adjust each line item to U.S. GAAP
are included in our Corporate segment. All references to net
earnings throughout the discussion of segment results refer
to net earnings from continuing operations attributable to
Procter & Gamble.
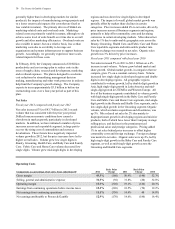
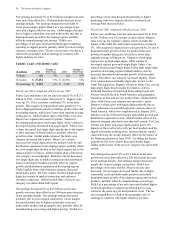
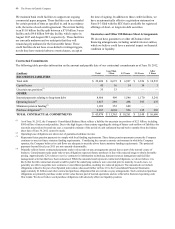
Net Sales Change Drivers vs. Year Ago (2012 vs. 2011)
Volume with
Acquisitions
& Divestitures
Volume
Excluding
Acquisitions
& Divestitures
Foreign
Exchange Price Mix/Other
Net Sales
Growth
Beauty 2% 2% 0% 3% -3% 2%
Grooming 1% 1% -1% 2% -1% 1%
Health Care 1% 0% 0% 3% -1% 3%
Fabric Care and Home Care -1% -1% 0% 5% -1% 3%
Baby Care and Family Care 1% 1% 0% 5% 0% 6%
TOTAL COMPANY 0% 0% 0% 4% -1% 3%
Net sales percentage changes are approximations based on quantitative formulas that are consistently applied.