Proctor and Gamble 2012 Annual Report Download - page 25
Download and view the complete annual report
Please find page 25 of the 2012 Proctor and Gamble annual report below. You can navigate through the pages in the report by either clicking on the pages listed below, or by using the keyword search tool below to find specific information within the annual report.-
 1
1 -
2
-
3
-
4
-
5
-
6
-
7
-
8
-
9
-
10
-
11
-
12
-
13
-
14
-
 15
15 -
 16
16 -
 17
17 -
 18
18 -
 19
19 -
 20
20 -
 21
21 -
 22
22 -
 23
23 -
 24
24 -
 25
25 -
 26
26 -
 27
27 -
 28
28 -
 29
29 -
 30
30 -
 31
31 -
 32
32 -
 33
33 -
 34
34 -
 35
35 -
36
-
37
-
38
-
39
-
40
-
41
-
42
-
43
-
44
-
45
-
46
-
47
-
48
-
49
-
50
-
51
-
52
-
53
-
54
-
55
-
56
-
57
-
58
-
59
-
60
-
61
-
62
-
63
-
64
-
65
-
66
-
67
-
68
-
69
-
70
-
71
-
72
-
73
-
74
-
75
-
76
-
77
-
78
-
79
-
80
-
81
-
82
-
83
-
84
-
85
-
86
-
87
-
88
-
89
-
90
-
91
-
92
 |
 |
The Procter & Gamble Company 23
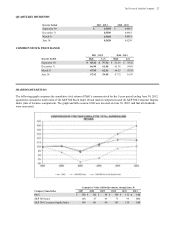
QUARTERLY DIVIDENDS
Quarter Ended 2011 - 2012 2010 – 2011
September 30 $ 0.5250 $ 0.4818
December 31 0.5250 0.4818
March 31 0.5250 0.4818
June 30 0.5620 0.5250
COMMON STOCK PRICE RANGE
2011 - 2012 2010 – 2011
Quarter Ended High Low High Low
September 30 $ 65.14 $ 57.56 $ 63.36 $ 58.92
December 31 66.98 61.00 65.38 59.68
March 31 67.95 62.56 66.95 59.70
June 30 67.92 59.08 67.72 61.47
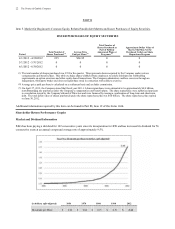
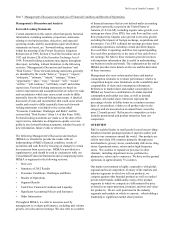
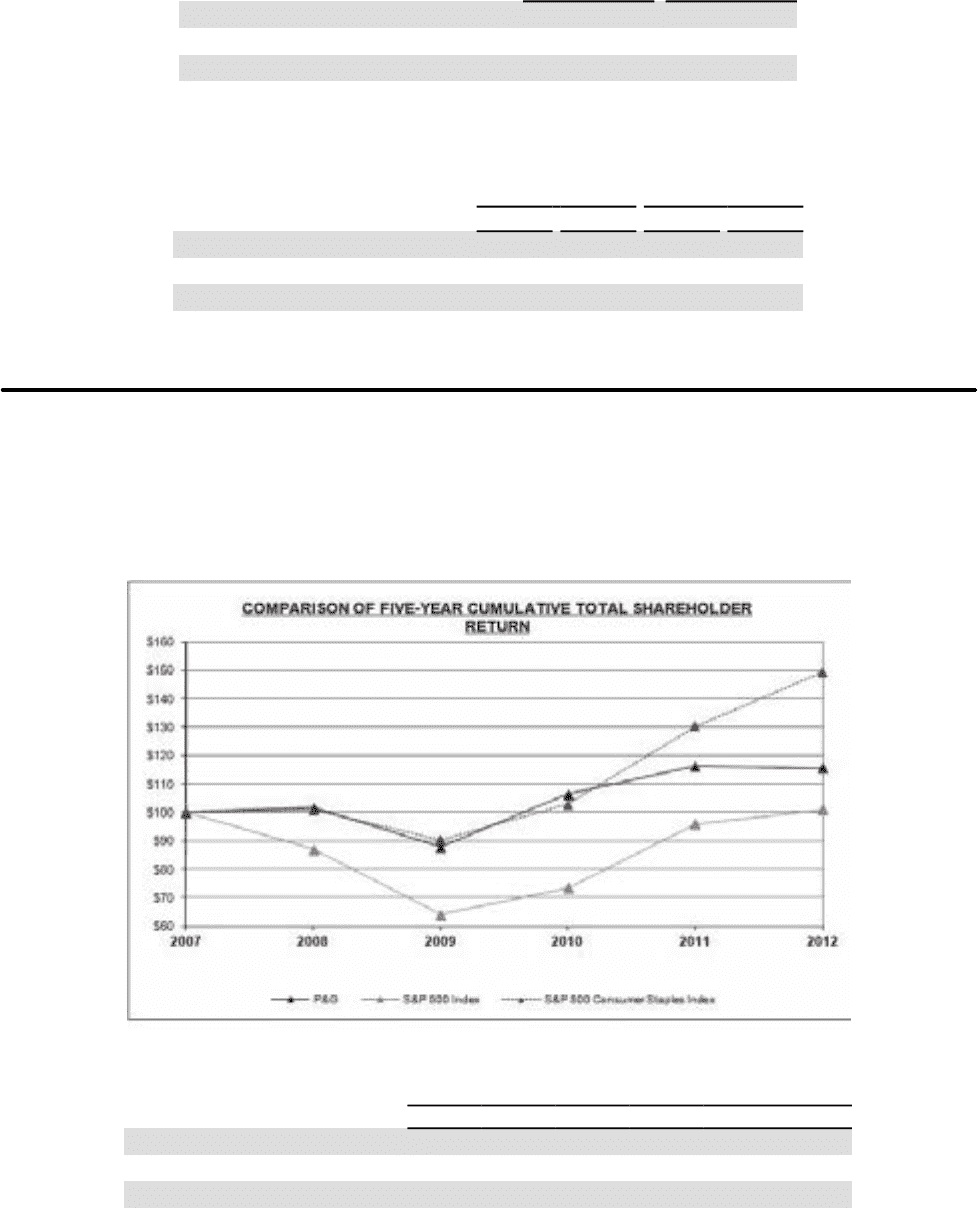
SHAREHOLDER RETURN
The following graph compares the cumulative total return of P&G’s common stock for the 5-year period ending June 30, 2012,
against the cumulative total return of the S&P 500 Stock Index (broad market comparison) and the S&P 500 Consumer Staples
Index (line of business comparison). The graph and table assume $100 was invested on June 30, 2007, and that all dividends
were reinvested.
Cumulative Value of $100 Investment, through June 30
Company Name/Index 2007 2008 2009 2010 2011 2012
P&G $ 100 $ 102 $ 88 $ 106 $ 116 $ 116
S&P 500 Index 100 87 64 73 96 101
S&P 500 Consumer Staples Index 100 101 90 103 130 149