Proctor and Gamble 2012 Annual Report Download - page 4
Download and view the complete annual report
Please find page 4 of the 2012 Proctor and Gamble annual report below. You can navigate through the pages in the report by either clicking on the pages listed below, or by using the keyword search tool below to find specific information within the annual report.-
 1
1 -
 2
2 -
 3
3 -
 4
4 -
 5
5 -
 6
6 -
 7
7 -
 8
8 -
 9
9 -
 10
10 -
 11
11 -
 12
12 -
 13
13 -
 14
14 -
 15
15 -
16
-
17
-
18
-
19
-
20
-
21
-
22
-
23
-
24
-
25
-
26
-
27
-
28
-
29
-
30
-
31
-
32
-
33
-
34
-
35
-
36
-
37
-
38
-
39
-
40
-
41
-
42
-
43
-
44
-
45
-
46
-
47
-
48
-
49
-
50
-
51
-
52
-
53
-
54
-
55
-
56
-
57
-
58
-
59
-
60
-
61
-
62
-
63
-
64
-
65
-
66
-
67
-
68
-
69
-
70
-
71
-
72
-
73
-
74
-
75
-
76
-
77
-
78
-
79
-
80
-
81
-
82
-
83
-
84
-
85
-
86
-
87
-
88
-
89
-
90
-
91
-
92
 |
 |

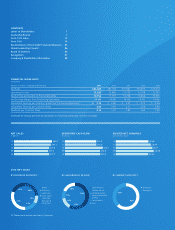
P&G’s Long-Term Growth Targets
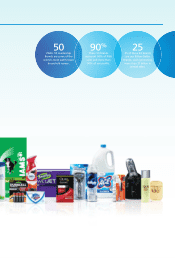
Organic Sales Growth 1 – 2% above global market growth rates
Core EPS Growth High single to low double digits
Free Cash Flow 90% of net earnings
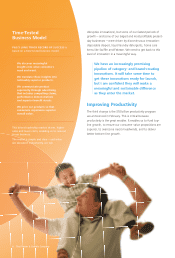
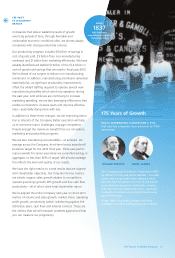
We’re celebrating P&G’s th anniversary this year, a milestone
that very few companies have achieved. Our long track record of
success is based on a time-tested business model
—
we discover
meaningful insights into what consumers need and want; we
translate those insights into noticeably superior products focused on
those needs; we communicate that superiority through advertising
that includes compelling claims, performance demonstrations,
and superior benefi t visuals; and we price our products at a point
where consumers experience superior overall value. All of this
drives leadership market share, higher sales and lower costs,
which enable us to reinvest in our business and win on a sustained
basis. This model is simple and clear
—
and when we execute it
consistently, we win.
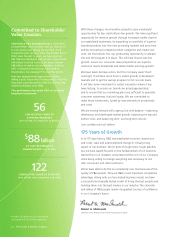
We have used this model to build a company
with nearly $ billion in sales and more than
$ billion in net earnings.
This model has also enabled P&G to deliver reliable and meaningful
growth over long periods of time, outperforming the market and
performing among the very best in our industry. Measuring from
the end of each quarter starting in , rolling -year returns have
exceeded both the S&P and the Dow Jones Industrial Average
in out of periods, or % of the time. And rolling -year
returns have exceeded both the S&P and the Dow Jones
Industrial Average in out of periods, or % of the time.
Within this longer-term track record, there have been shorter periods
of underperformance, as we’ve experienced the past couple of
years. These have typically been followed by periods of strong out-
performance. This past track record does not in any way guarantee
future success. It does refl ect, however, the strength of our time-
tested business model.
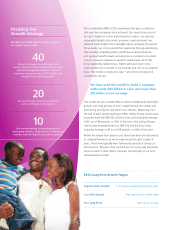
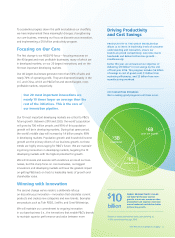
Focusing Our
Growth Strategy
WE ARE FOCUSING P&G’S growth strategy on
our biggest opportunities:
We are focusing on our largest and
most profi table product categories in the most
important geographic markets. These
businesses represent about % of sales and
nearly % of operating profi t.
We are focusing resources on winning
with our largest innovations.
We are maintaining strong momentum in
developing markets, targeting the developing
markets with the highest potential for growth.
2 The Procter & Gamble Company