Proctor and Gamble 2012 Annual Report Download - page 41
Download and view the complete annual report
Please find page 41 of the 2012 Proctor and Gamble annual report below. You can navigate through the pages in the report by either clicking on the pages listed below, or by using the keyword search tool below to find specific information within the annual report.-
 1
1 -
2
-
3
-
4
-
5
-
6
-
7
-
8
-
9
-
10
-
11
-
12
-
13
-
14
-
15
-
16
-
17
-
18
-
19
-
20
-
21
-
22
-
23
-
24
-
25
-
26
-
27
-
28
-
29
-
30
-
 31
31 -
 32
32 -
 33
33 -
 34
34 -
 35
35 -
 36
36 -
 37
37 -
 38
38 -
 39
39 -
 40
40 -
 41
41 -
 42
42 -
 43
43 -
 44
44 -
 45
45 -
 46
46 -
 47
47 -
 48
48 -
 49
49 -
 50
50 -
 51
51 -
52
-
53
-
54
-
55
-
56
-
57
-
58
-
59
-
60
-
61
-
62
-
63
-
64
-
65
-
66
-
67
-
68
-
69
-
70
-
71
-
72
-
73
-
74
-
75
-
76
-
77
-
78
-
79
-
80
-
81
-
82
-
83
-
84
-
85
-
86
-
87
-
88
-
89
-
90
-
91
-
92
 |
 |
The Procter & Gamble Company 39
capital was a net source of cash.
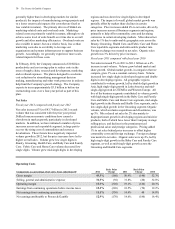
Free Cash Flow. We view free cash flow as an important
measure because it is a factor impacting the amount of cash
available for dividends and other discretionary investment. It
is defined as operating cash flow less capital expenditures
and is one of the measures used to evaluate senior
management and determine their at-risk compensation.
Fiscal year 2012 compared with fiscal year 2011
Free cash flow was $9.3 billion in 2012, a decrease of 7%
versus the prior year. Free cash flow decreased primarily
due to higher capital spending to support geographic
expansion. Free cash flow productivity, defined as the ratio
of free cash flow to net earnings, was 85% in 2012.
Fiscal year 2011 compared with fiscal year 2010
In 2011, free cash flow was $10.0 billion, a decrease of 23%
versus the prior year. Free cash flow decreased due to lower
operating cash flow and higher capital spending. Free cash
flow productivity was 84% in 2011.
Investing Cash Flows
Fiscal year 2012 compared with fiscal year 2011
Net investing activities consumed $1.1 billion in cash in
2012 mainly due to capital spending, partially offset by
proceeds from asset sales of $2.9 billion. These proceeds
were primarily related to cash received from the sale of our
snacks business in 2012.
Fiscal year 2011 compared with fiscal year 2010
In 2011, net investing activities consumed $3.5 billion of
cash due to capital spending and acquisitions, partially offset
by proceeds from asset sales.
Capital Spending. We view capital spending efficiency as a
critical component of our overall cash management strategy.
We manage capital spending to support our business growth
plans and have cost controls to deliver our cash generation
targets. Capital expenditures, primarily to support capacity
expansion, innovation and cost savings, were $4.0 billion in
2012 and $3.3 billion in 2011. The increase in capital
spending resulted primarily from capacity expansions.
Capital spending as a percentage of net sales increased 60
basis points to 4.7% in 2012. Capital spending for our
discontinued snacks business was approximately $60 million
in 2012. As we continue to support growth, capital spending
in total and as a percentage of net sales is expected to
increase in fiscal 2013. Capital spending as a percentage of
net sales increased 10 basis points to 4.1% in 2011.
Acquisitions. Acquisitions used $134 million of cash in 2012
primarily for the acquisition of New Chapter, a vitamins
supplement business. In 2011, acquisitions used $474
million of cash primarily for the acquisition of Ambi Pur, an
air freshener business.
Proceeds from Divestitures and Other Asset Sales. Proceeds
from asset sales contributed $2.9 billion to cash in 2012
mainly due to the sale of our snacks business. In 2011,
proceeds from asset sales contributed $225 million to cash
mainly due to the sale of our Infasil brand in Western Europe
and Zest brand in North America.
Financing Cash Flows
Dividend Payments. Our first discretionary use of cash is
dividend payments. Dividends per common share increased
8% to $2.14 per share in 2012. Total dividend payments to
common and preferred shareholders were $6.1 billion in
2012 and $5.8 billion in 2011. The increase in dividend
payments resulted from increases in our quarterly dividends
per share, partially offset by a reduction in the number of
shares outstanding. In April 2012, the Board of Directors
declared an increase in our quarterly dividend from $0.525
to $0.562 per share on Common Stock and Series A and B
ESOP Convertible Class A Preferred Stock. This represents a
7% increase compared to the prior quarterly dividend and is
the 56th consecutive year that our dividend has increased.
We have paid a dividend in every year since our
incorporation in 1890.
Long-Term and Short-Term Debt. We maintain debt levels
we consider appropriate after evaluating a number of factors,
including cash flow expectations, cash requirements for
ongoing operations, investment and financing plans
(including acquisitions and share repurchase activities) and
the overall cost of capital. Total debt was $29.8 billion as of
June 30, 2012 and $32.0 billion as of June 30, 2011. Our
total debt decreased in 2012 mainly due to bonds reaching
maturity and a reduction in commercial paper outstanding,
partially offset by debt issuances.
Treasury Purchases. Total share repurchases were $4.0
billion in 2012 and $7.0 billion in 2011.
Liquidity
At June 30, 2012 our current liabilities exceeded current
assets by $3.0 billion, largely due to short-term borrowings
under our commercial paper program. We anticipate being
able to support our short-term liquidity and operating needs
largely through cash generated from operations. We utilize
short- and long-term debt to fund discretionary items, such
as acquisitions and share repurchases. We have strong short-
and long-term debt ratings, which have enabled and should
continue to enable us to refinance our debt as it becomes due
at favorable rates in commercial paper and bond markets. In
addition, we have agreements with a diverse group of
financial institutions that, if needed, should provide
sufficient credit funding to meet short-term financing
requirements.
On June 30, 2012, our short-term credit ratings were P-1
(Moody's) and A-1+ (Standard & Poor's), while our long-
term credit ratings are Aa3 (Moody's) and AA- (Standard &
Poor's), both with a stable outlook.