Proctor and Gamble 2012 Annual Report Download - page 68
Download and view the complete annual report
Please find page 68 of the 2012 Proctor and Gamble annual report below. You can navigate through the pages in the report by either clicking on the pages listed below, or by using the keyword search tool below to find specific information within the annual report.-
 1
1 -
2
-
3
-
4
-
5
-
6
-
7
-
8
-
9
-
10
-
11
-
12
-
13
-
14
-
15
-
16
-
17
-
18
-
19
-
20
-
21
-
22
-
23
-
24
-
25
-
26
-
27
-
28
-
29
-
30
-
31
-
32
-
33
-
34
-
35
-
36
-
37
-
38
-
39
-
40
-
41
-
42
-
43
-
44
-
45
-
46
-
47
-
48
-
49
-
50
-
51
-
52
-
53
-
54
-
55
-
56
-
57
-
 58
58 -
 59
59 -
 60
60 -
 61
61 -
 62
62 -
 63
63 -
 64
64 -
 65
65 -
 66
66 -
 67
67 -
 68
68 -
 69
69 -
 70
70 -
 71
71 -
 72
72 -
 73
73 -
 74
74 -
 75
75 -
 76
76 -
 77
77 -
 78
78 -
79
-
80
-
81
-
82
-
83
-
84
-
85
-
86
-
87
-
88
-
89
-
90
-
91
-
92
 |
 |
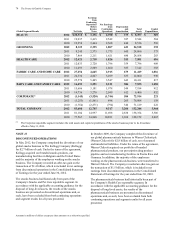
66 The Procter & Gamble Company
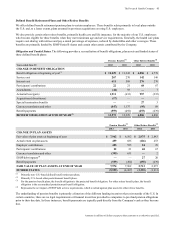
Amounts in millions of dollars except per share amounts or as otherwise specified.
Pension Benefits Other Retiree Benefits
Years ended June 30 2012 2011 2012 2011
CLASSIFICATION OF NET AMOUNT RECOGNIZED
Noncurrent assets $ 128 $ 168 $—
$—
Current liability (43)(47)(23)(24)
Noncurrent liability (5,684)(4,388)(3,270)(1,887)
NET AMOUNT RECOGNIZED (5,599)(4,267)(3,293)(1,911)
AMOUNTS RECOGNIZED IN ACCUMULATED OTHER
COMPREHENSIVE INCOME (AOCI)
Net actuarial loss $ 4,010 $ 2,315 $ 3,565 $ 2,181
Prior service cost /(credit) 261 354 (75)(92)
NET AMOUNTS RECOGNIZED IN AOCI 4,271 2,669 3,490 2,089
CHANGE IN PLAN ASSETS AND BENEFIT OBLIGATIONS
RECOGNIZED IN ACCUMULATED OTHER COMPREHENSIVE
INCOME (AOCI)
Net actuarial loss /(gain) - current year $ 2,009 $(827)$ 1,516 $(60)
Prior service cost/(credit) - current year (44)93 —7
Amortization of net actuarial loss (102)(154)(99)(96)
Amortization of prior service (cost) / credit (21)(18)20 18
Settlement / curtailment cost (6)———
Currency translation and other (234)262 (36)20
TOTAL CHANGE IN AOCI 1,602 (644)1,401 (111)
NET AMOUNTS RECOGNIZED IN PERIODIC BENEFIT COST AND
AOCI 2,036 (106)1,417 (124)
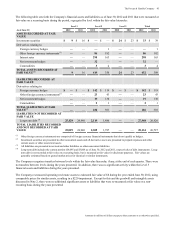
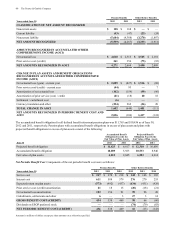
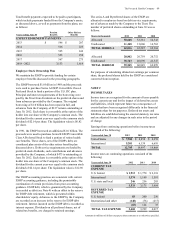
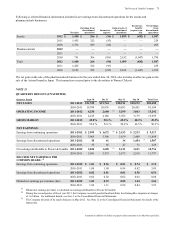
The accumulated benefit obligation for all defined benefit retirement pension plans was $11,763 and $10,436 as of June 30,
2012 and 2011, respectively. Pension plans with accumulated benefit obligations in excess of plan assets and plans with
projected benefit obligations in excess of plan assets consist of the following:
Accumulated Benefit
Obligation Exceeds the
Fair Value of Plan Assets
Projected Benefit
Obligation Exceeds the
Fair Value of Plan Assets
June 30 2012 2011 2012 2011
Projected benefit obligation $ 11,623 $ 6,817 $ 12,310 $ 10,650
Accumulated benefit obligation 10,009 5,923 10,533 8,940
Fair value of plan assets 6,013 2,845 6,583 6,214
Net Periodic Benefit Cost.Components of the net periodic benefit cost were as follows:
Pension Benefits Other Retiree Benefits
Years ended June 30 2012 2011 2010 2012 2011 2010
Service cost $ 267 $ 270 $ 218 $ 142 $ 146 $ 103
Interest cost 611 588 579 276 270 253
Expected return on plan assets (573)(492)(437)(434)(431)(429)
Prior service cost /(credit) amortization 21 18 15 (20)(18)(21)
Net actuarial loss amortization 102 154 91 99 96 20
Curtailments, settlements and other 6—3
27 3 14
GROSS BENEFIT COST/(CREDIT) 434 538 469 90 66 (60)
Dividends on ESOP preferred stock ———
(74)(79)(83)
NET PERIODIC BENEFIT COST/(CREDIT) 434 538 469 16 (13)(143)