Proctor and Gamble 2012 Annual Report Download - page 39
Download and view the complete annual report
Please find page 39 of the 2012 Proctor and Gamble annual report below. You can navigate through the pages in the report by either clicking on the pages listed below, or by using the keyword search tool below to find specific information within the annual report.-
 1
1 -
2
-
3
-
4
-
5
-
6
-
7
-
8
-
9
-
10
-
11
-
12
-
13
-
14
-
15
-
16
-
17
-
18
-
19
-
20
-
21
-
22
-
23
-
24
-
25
-
26
-
27
-
28
-
 29
29 -
 30
30 -
 31
31 -
 32
32 -
 33
33 -
 34
34 -
 35
35 -
 36
36 -
 37
37 -
 38
38 -
 39
39 -
 40
40 -
 41
41 -
 42
42 -
 43
43 -
 44
44 -
 45
45 -
 46
46 -
 47
47 -
 48
48 -
 49
49 -
50
-
51
-
52
-
53
-
54
-
55
-
56
-
57
-
58
-
59
-
60
-
61
-
62
-
63
-
64
-
65
-
66
-
67
-
68
-
69
-
70
-
71
-
72
-
73
-
74
-
75
-
76
-
77
-
78
-
79
-
80
-
81
-
82
-
83
-
84
-
85
-
86
-
87
-
88
-
89
-
90
-
91
-
92
 |
 |

The Procter & Gamble Company 37
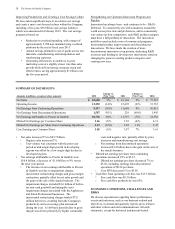
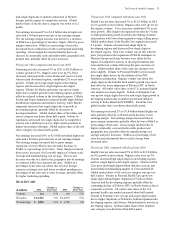
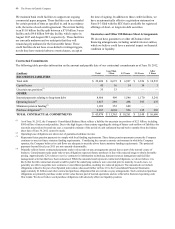
BABY CARE AND FAMILY CARE
($ millions) 2012
Change vs.
Prior Year 2011
Change vs.
Prior Year
Volume n/a +1% n/a +8%
Net sales $ 16,493 +6% $ 15,606 +6%
Net earnings $ 2,123 +7% $ 1,978 -3%
Fiscal year 2012 compared with fiscal year 2011
Baby Care and Family Care net sales increased 6% to $16.5
billion in 2012 on 1% volume growth. Organic sales were up
6%. Pricing added 5% to net sales growth. Global market
share of the Baby Care and Family Care segment increased
0.2 points. Volume grew double digits in developing regions
and decreased low single digits in developed regions.
Volume in Baby Care was up mid-single digits behind
market size growth and distribution expansion in developing
regions, partially offset by declines in North America and
Western Europe from diaper market contraction. Global
market share of the baby care category increased more than
half a point. Volume in Family Care decreased low single
digits primarily due to competitive activity and the impact of
a price increase in North America. In the U.S., all-outlet
share of the family care category was down half a point.
Net earnings increased 7% to $2.1 billion due to sales
growth and a 20-basis point increase in net earnings margin.
Net earnings margin increased mainly due to a decrease in
SG&A as a percentage of net sales, partially offset by a
lower gross margin. The reduction in gross margin was
driven primarily by higher commodity costs and unfavorable
geographic and product mix, partially offset by the impact of
higher pricing. SG&A as a percentage of net sales decreased
due to scale leverage from increased sales.
Fiscal year 2011 compared with fiscal year 2010
Baby Care and Family Care net sales increased 6% in 2011
to $15.6 billion on 8% volume growth. Organic sales were
up 7%. Mix reduced net sales by 2% driven mainly by
disproportionate growth of mid-tier product lines, larger
package sizes and developing regions, all of which have
lower than segment average selling prices. Pricing added 1%
to net sales growth primarily due to price increases executed
in Baby Care to offset higher commodity costs and foreign
exchange. Unfavorable foreign exchange negatively
impacted net sales by 1%. Volume grew double digits in
developing regions and mid-single digits in developed
regions. Volume in Baby Care was up high single digits
primarily due to double-digit growth in developing regions
behind initiative activity, market growth and distribution
expansion. Global market share of the baby care category
increased over 1 point. Volume in Family Care increased
high single digits driven by the continued impact of
initiatives launched in prior periods, with high single-digit
growth in North America. In the U.S., all-outlet share of the
family care category increased half a point.
Net earnings decreased 3% to $2.0 billion as net sales
growth was more than offset by a 120-basis point reduction
in net earnings margin. Net earnings margin declined
mainly due to a lower gross margin, partially offset by a
decrease in SG&A as a percentage of net sales. The
reduction in gross margin was driven by higher commodity
costs and unfavorable product mix, behind disproportionate
growth of mid-tier product lines, larger package sizes and
developing regions, which were only partially offset by the
favorable impact of volume scale leverage and
manufacturing cost savings. SG&A as a percentage of net
sales declined due to lower foreign currency exchange costs.
CORPORATE
Corporate includes certain operating and non-operating
activities not allocated to specific business units. These
include: the incidental businesses managed at the corporate
level; financing and investing activities; other general
corporate items; the historical results of certain divested
brands and categories; certain asset impairment charges; and
certain restructuring-type activities to maintain a competitive
cost structure, including manufacturing and workforce
optimization. Corporate also includes reconciling items to
adjust the accounting policies used in the segments to U.S.
GAAP. The most significant reconciling items include
income taxes (to adjust from statutory rates that are reflected
in the segments to the overall Company effective tax rate),
adjustments for unconsolidated entities (to eliminate net
sales, cost of products sold and SG&A for entities that are
consolidated in the segments but accounted for using the
equity method for U.S. GAAP) and noncontrolling interest
adjustments for subsidiaries where we do not have 100%
ownership. Since certain unconsolidated entities and less
than 100%-owned subsidiaries are managed as integral parts
of the related segments, they are accounted for similar to a
wholly-owned subsidiary for management and segment
purposes. This means our segment results recognize 100% of
each income statement component through before-tax
earnings in the segments, with eliminations for
unconsolidated entities and noncontrolling interests in
Corporate. In determining segment net earnings, we apply
the statutory tax rates (with adjustments to arrive at the
Company's effective tax rate in Corporate) and eliminate the
share of earnings applicable to other ownership interests, in
a manner similar to noncontrolling interest.
Corporate net sales primarily reflect the adjustment to
eliminate the sales of unconsolidated entities included in
business segment results. Accordingly, Corporate net sales
are generally negative. Negative net sales in Corporate
decreased by $108 million due to adjustments required to
eliminate the lower net sales of unconsolidated entities. Net
Corporate expenses increased $2.2 billion primarily due to
the net after tax goodwill and intangibles impairment
charges of $1.5 billion, incremental after-tax restructuring
charges of $587 million and the impact of lower net discrete
tax adjustments in the current year. Additional discussion of
the items impacting net earnings in Corporate are included in
the Results of Operations section.