Proctor and Gamble 1999 Annual Report Download - page 46
Download and view the complete annual report
Please find page 46 of the 1999 Proctor and Gamble annual report below. You can navigate through the pages in the report by either clicking on the pages listed below, or by using the keyword search tool below to find specific information within the annual report.-
 1
1 -
2
-
3
-
4
-
5
-
6
-
7
-
8
-
9
-
10
-
11
-
12
-
13
-
14
-
15
-
16
-
17
-
18
-
19
-
20
-
21
-
22
-
23
-
24
-
25
-
26
-
27
-
28
-
29
-
30
-
31
-
32
-
33
-
34
-
35
-
 36
36 -
 37
37 -
 38
38 -
 39
39 -
 40
40 -
 41
41 -
 42
42 -
 43
43 -
 44
44 -
 45
45 -
 46
46 -
 47
47 -
 48
48 -
 49
49 -
 50
50 -
 51
51 -
 52
52 -
 53
53 -
 54
54
 |
 |
42
The Procter & Gamble Company and Subsidiaries
NOTES TO CONSOLIDATED FINANCIAL STATEMENTS (CONTINUED)
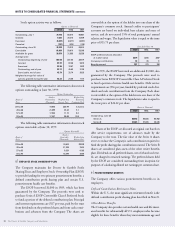
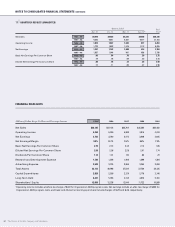
13 QUARTERLY RESULTS (UNAUDITED)
Quarters Ended Total
Sept. 30 Dec. 31 Mar. 31 June 30*Year*
Net Sales 1998–99 $9,510 $9,934 $9,231 $9,450 $38,125
1997–98 9,355 9,641 8,881 9,277 37,154
Operating Income 1998–99 1,874 1,837 1,665 877 6,253
1997–98 1,739 1,688 1,516 1,112 6,055
Net Earnings 1998–99 1,167 1,142 1,040 414 3,763
1997–98 1,087 1,046 961 686 3,780
Basic Net Earnings Per Common Share 1998–99 .86 .84 .76 .29 2.75
1997–98 .79 .76 .69 .50 2.74
Diluted Net Earnings Per Common Share 1998–99 .80 .78 .72 .29 2.59
1997–98 .73 .71 .65 .47 2.56
FINANCIAL HIGHLIGHTS
Millions of Dollars Except Per Share and Percentage Amounts 1999*1998 1997 1996 1995
Net Sales $38,125 $37,154 $35,764 $35,284 $33,482
Operating Income 6,253 6,055 5,488 4,815 4,244
Net Earnings 3,763 3,780 3,415 3,046 2,645
Net Earnings Margin 9.9% 10.2% 9.5% 8.6% 7.9%
Basic Net Earnings Per Common Share 2.75 2.74 2.43 2.14 1.85
Diluted Net Earnings Per Common Share 2.59 2.56 2.28 2.01 1.74
Dividends Per Common Share 1.14 1.01 .90 .80 .70
Research and Development Expense 1,726 1,546 1,469 1,399 1,304
Advertising Expense 3,538 3,704 3,466 3,254 3,284
Total Assets 32,113 30,966 27,544 27,730 28,125
Capital Expenditures 2,828 2,559 2,129 2,179 2,146
Long-Term Debt 6,231 5,765 4,143 4,670 5,161
Shareholders’ Equity 12,058 12,236 12,046 11,722 10,589
*Operating income includes a before-tax charge of $481 for Organization 2005 program costs. Net earnings include an after-tax charge of $385 for
Organization 2005 program costs, and basic and diluted net earnings per share include charges of $.29 and $.26, respectively.