Proctor and Gamble 1999 Annual Report Download - page 2
Download and view the complete annual report
Please find page 2 of the 1999 Proctor and Gamble annual report below. You can navigate through the pages in the report by either clicking on the pages listed below, or by using the keyword search tool below to find specific information within the annual report.-
 1
1 -
 2
2 -
 3
3 -
 4
4 -
 5
5 -
 6
6 -
 7
7 -
 8
8 -
 9
9 -
 10
10 -
 11
11 -
 12
12 -
 13
13 -
14
-
15
-
16
-
17
-
18
-
19
-
20
-
21
-
22
-
23
-
24
-
25
-
26
-
27
-
28
-
29
-
30
-
31
-
32
-
33
-
34
-
35
-
36
-
37
-
38
-
39
-
40
-
41
-
42
-
43
-
44
-
45
-
46
-
47
-
48
-
49
-
50
-
51
-
52
-
53
-
54
 |
 |

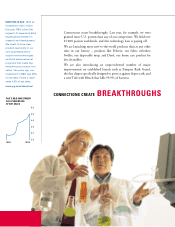
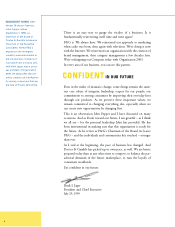
Durk I. Jager, President
and Chief Executive, at one
of Procter & Gamble’s
21 technical centers.
GOOD RESULTS DESPITE REGIONAL ECONOMIC CRISES
Fiscal year 1998-99 was a good year for our shareholders, but not a great year. We know
we can do better, and we must.
We must increase P&G’s pace of growth – what we call our business vitality. This comes
from increased innovation vitality, the contribution that new and improved products
make to our growth. It also comes from increased organization vitality, the degree to
which people perform above their expectations, outside their comfort zone, to produce
continually better results.
We are already beginning to see an increase in P&G’s business vitality. Our 1999 results
were good, particularly given economic crises in many regions of the world, including
Russia, Brazil and many parts of Asia.
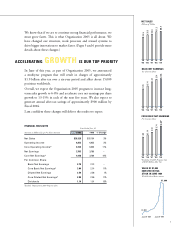
•Net earnings for the fiscal year were $3.76 billion, including charges of $385 million
after tax for the Fiscal 1999 costs of Organization 2005, our major initiative to accel-
erate growth through far-reaching changes in structure, work processes and culture.
•Core net earnings, which exclude Organization 2005 costs, were $4.15 billion or
$3.04 basic net earnings per share – an 11% increase over the prior year.
•Every region achieved double-digit earnings growth. This was driven by introduction
of more value-added initiatives, effective cost containment and improved pricing. In
fact, our margin on core net earnings was the highest in 58 years.
•Net sales grew to a record $38.1 billion, up 3% versus last year. While this growth rate
was below our expectations, we are encouraged by the increased percentage of sales in
products that leverage our technology advantages.
•The Company continued to generate strong operating cash flow of $5.5 billion, up
more than 12% over the previous year.