Proctor and Gamble 1999 Annual Report Download - page 3
Download and view the complete annual report
Please find page 3 of the 1999 Proctor and Gamble annual report below. You can navigate through the pages in the report by either clicking on the pages listed below, or by using the keyword search tool below to find specific information within the annual report.-
 1
1 -
 2
2 -
 3
3 -
 4
4 -
 5
5 -
 6
6 -
 7
7 -
 8
8 -
 9
9 -
 10
10 -
 11
11 -
 12
12 -
 13
13 -
 14
14 -
15
-
16
-
17
-
18
-
19
-
20
-
21
-
22
-
23
-
24
-
25
-
26
-
27
-
28
-
29
-
30
-
31
-
32
-
33
-
34
-
35
-
36
-
37
-
38
-
39
-
40
-
41
-
42
-
43
-
44
-
45
-
46
-
47
-
48
-
49
-
50
-
51
-
52
-
53
-
54
 |
 |
1.85
2.14
2.43
2.74
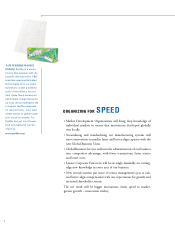
3.04*
’95 ’96 ’97 ’98 ’99
’95 ’96 ’97 ’98 ’99
1
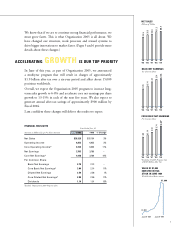
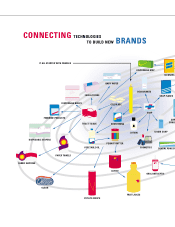
We know that if we are to continue strong financial performance, we
must grow faster. This is what Organization 2005 is all about. We
have changed our structure, work processes and reward systems to
drive bigger innovations to market faster. (Pages 5 and 6 provide more
details about these changes.)
ACCELERATING GROWTH IS OUR TOP PRIORITY
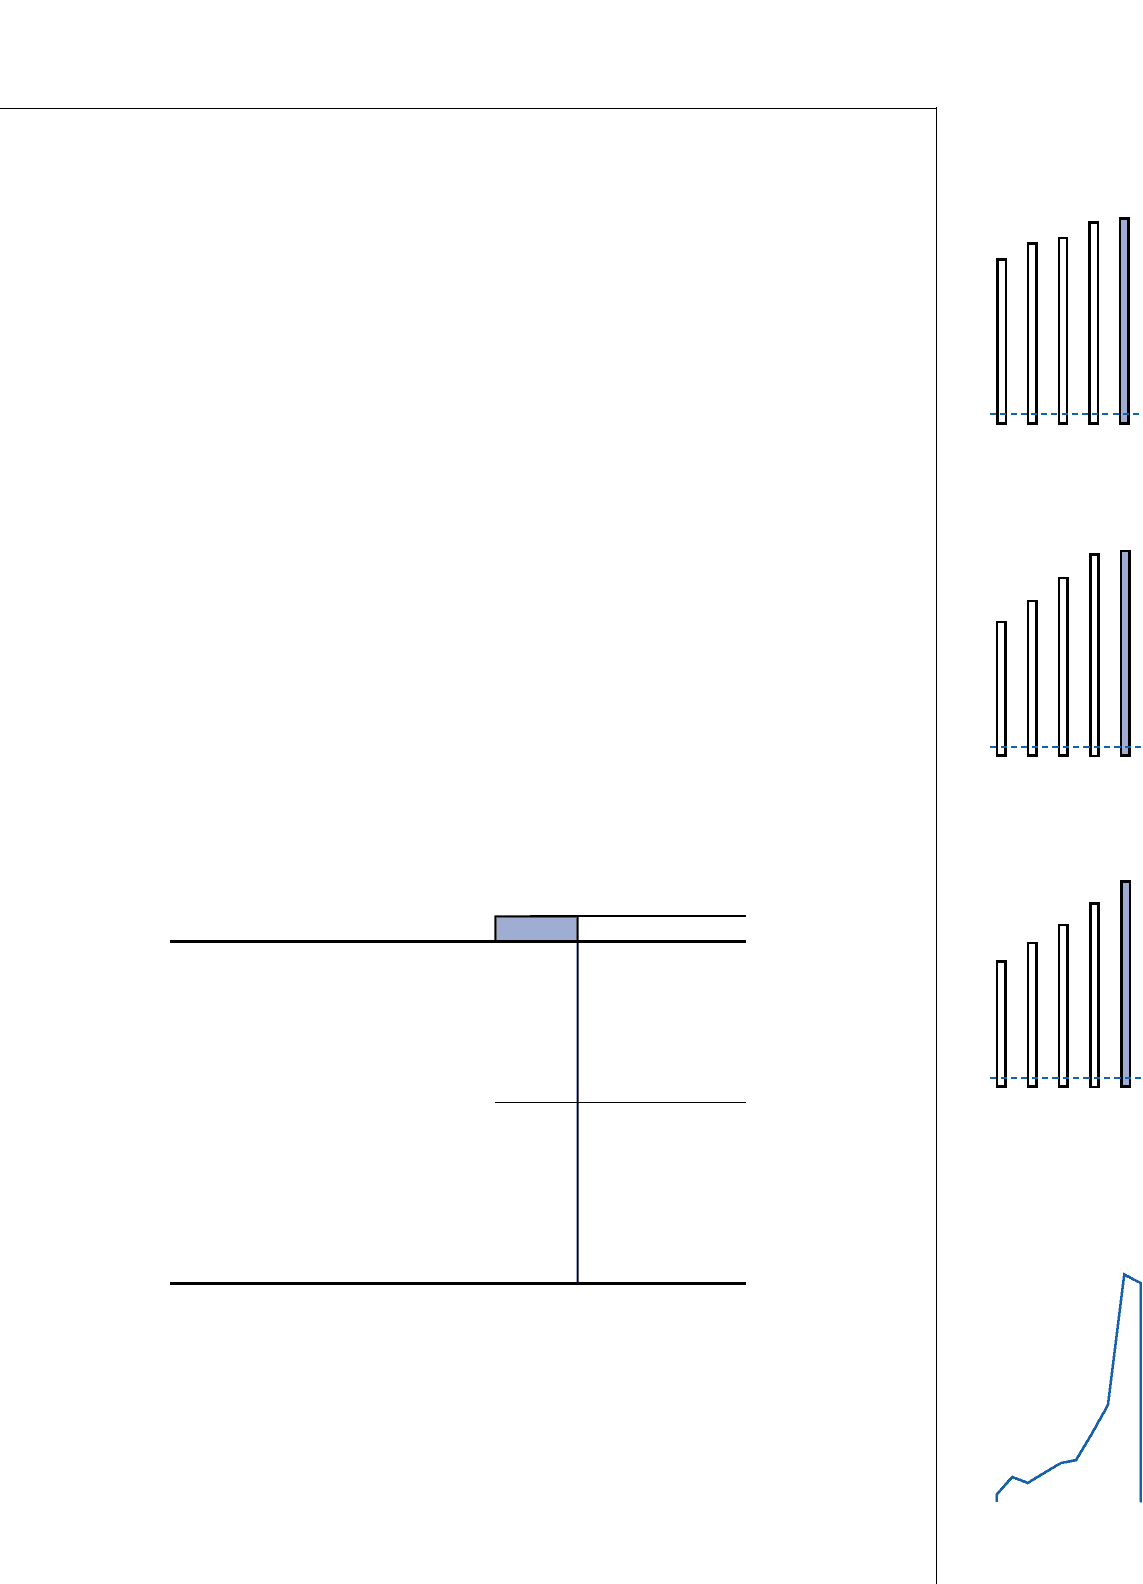
$7,800
June ’89 June ’99
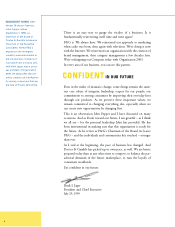
33.5
35.3
35.8
37.2
38.1
’95 ’96 ’97 ’98 ’99
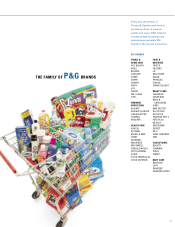
1.85
2.14
2.43
2.74
2.75
BASIC NET EARNINGS
Per Common Share
NET SALES
Billions of Dollars
CORE BASIC NET EARNINGS
Per Common Share
FINANCIAL HIGHLIGHTS
VALUE OF $1,000
INVESTED IN P&G
STOCK IN JUNE 1989
With Dividend Reinvestment
Years Ended June 30
Amounts in Millions Except Per Share Amounts 1999 1998 % Change
Net Sales $38,125 $37,154 3%
Operating Income 6,253 6,055 3%
Core Operating Income* 6,734 6,055 11%
Net Earnings 3,763 3,780 –
Core Net Earnings* 4,148 3,780 10%
Per Common Share
Basic Net Earnings 2.75 2.74 –
Core Basic Net Earnings* 3.04 2.74 11%
Diluted Net Earnings 2.59 2.56 1%
Core Diluted Net Earnings* 2.85 2.56 11%
Dividends 1.14 1.01 13%
*Excluding O-2005 Program Costs
of $385 Million After Tax
$1,000
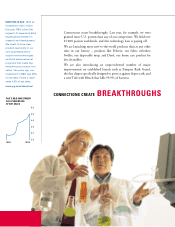
In June of this year, as part of Organization 2005, we announced
a multiyear program that will result in charges of approximately
$1.9 billion after tax over a six-year period and affect about 15,000
positions worldwide.
Overall, we expect the Organization 2005 program to increase long-
term sales growth to 6-8% and accelerate core net earnings per share
growth to 13-15% in each of the next five years. We also expect to
generate annual after-tax savings of approximately $900 million by
Fiscal 2004.
I am confident these changes will deliver the results we expect.
*Excludes Organization 2005 Program Costs