Proctor and Gamble 1999 Annual Report Download - page 19
Download and view the complete annual report
Please find page 19 of the 1999 Proctor and Gamble annual report below. You can navigate through the pages in the report by either clicking on the pages listed below, or by using the keyword search tool below to find specific information within the annual report.-
 1
1 -
2
-
3
-
4
-
5
-
6
-
7
-
8
-
 9
9 -
 10
10 -
 11
11 -
 12
12 -
 13
13 -
 14
14 -
 15
15 -
 16
16 -
 17
17 -
 18
18 -
 19
19 -
 20
20 -
 21
21 -
 22
22 -
 23
23 -
 24
24 -
 25
25 -
 26
26 -
 27
27 -
 28
28 -
 29
29 -
30
-
31
-
32
-
33
-
34
-
35
-
36
-
37
-
38
-
39
-
40
-
41
-
42
-
43
-
44
-
45
-
46
-
47
-
48
-
49
-
50
-
51
-
52
-
53
-
54
 |
 |

The Procter & Gamble Company and Subsidiaries
15
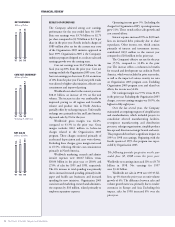
Worldwide gross margin increased to 43.3%
from 42.7% in 1997, reflecting cost savings,
including the Company’s simplification and stan-
dardization efforts.
Worldwide marketing, research and admin-
istrative expenses were 27.0% of sales compared
with 27.3% in 1997. The increase in absolute
spending was primarily due to increased market-
ing support behind new initiatives, such as
Tampax and Fat Free Pringles, and the expansion
of existing brands into new markets.
Operating income grew 10% in 1998, pri-
marily reflecting sales growth and cost control
efforts. The Company’s net earnings margin
increased from 9.5% in 1997 to 10.2% in 1998.
Interest expense increased 20% to $548 mil-
lion in 1998, on increased debt, due mainly
to acquisitions. In 1997, interest expense was
$457 million. Other income, net, was $201 mil-
lion in 1998, versus $218 million in 1997.
The Company’s effective tax rate for the
year was 33.8%, compared to 34.9% in 1997.
The decline reflected the benefits of lower effec-
tive tax rates in Europe, increased research and
development tax credits in North America,
and continued focus on tax planning.
FINANCIAL CONDITION
Cash flow from operations was $5.54 billion,
$4.89 billion and $5.88 billion in 1999, 1998 and
1997, respectively. Operating cash flow provided
the primary source of funds to finance operating
needs, capital expenditures and acquisitions.
Operating cash flow, supplemented by additional
borrowings, provided the primary source of funds
to finance the share repurchase program.
Cash and cash equivalents increased
$745 million in the current year to $2.29 billion.
The increase was primarily concentrated in
Europe and was due to improved profitability.
In the prior year, cash and cash equivalents
decreased by $801 million to $1.55 billion, reflect-
ing acquisitions and increased capital spending.
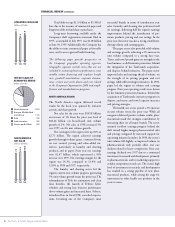
Capital expenditures were $2.83 billion in
1999, $2.56 billion in 1998 and $2.13 billion
in 1997. Current year expenditures included
standardization projects in the paper business and
capacity expansions in tissue and towel and in
snacks. Capital expenditures are expected to
increase in the upcoming year, reflecting
Organization 2005 projects and capacity
increases in laundry and cleaning and in paper. In
1998, capital expenditures related primarily to
capacity expansion in the paper and food busi-
nesses.
Net cash used for acquisitions completed
during 1999 totaled $137 million, compared to
$3.27 billion in 1998 and $150 million in 1997.
Transactions in fiscal 1998 were largely concen-
trated in paper businesses and included
Tambrands, Inc., the Loreto y Peña paper
company in Mexico and the Ssangyong Paper
Company in Korea. The Company also increased
ownership of various joint ventures in Asia and
Latin America in 1998.
The Company continued to divest certain
non-strategic brands in 1999 in order to focus
resources on the Company’s core businesses. The
proceeds from these and other asset sales gener-
ated $434 million in cash flow in the current
year, compared to $555 million and $520 million
in 1998 and 1997, respectively.
The Company maintains a share repurchase
program, which authorizes the Company to pur-
chase shares annually on the open market to
mitigate the dilutive impact of employee com-
pensation programs. The Company also has a
discretionary buy-back program under which it
currently intends to repurchase additional
outstanding shares of up to $1 billion per year.
Current year purchases under the repurchase
programs were above normal at $2.53 billion,
compared to $1.93 billion in 1998 and $1.65
billion in 1997.
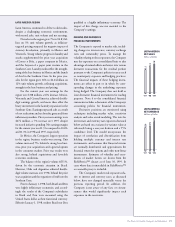
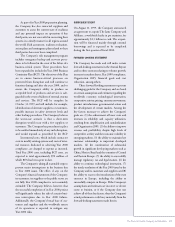
Common share dividends grew 13% to $1.14
per share in 1999, compared to $1.01 and $.90 in
1998 and 1997, respectively. For the coming year,
the annual dividend rate will increase to $1.28 per
common share, marking the forty-fourth consec-
utive year of increased common share dividend
payments. Total dividend payments, to both com-
mon and preferred shareholders, were $1.63 billion,
$1.46 billion and $1.33 billion in 1999, 1998 and
1997, respectively.
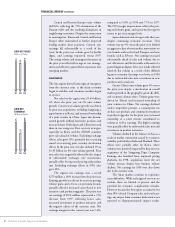
9.5%
10.2%
9.9%
’97 ’98 ’99
NET EARNINGS
MARGIN %
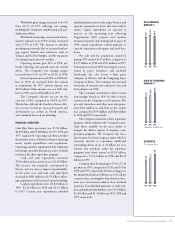
9.5%
10.2%
10.9%
’97 ’98 ’99
CORE NET EARNINGS
MARGIN %*
*Excluding O-2005 Costs
0.90
1.01
1.14
’97 ’98 ’99
DIVIDENDS
Per Common Share