Proctor and Gamble 1999 Annual Report Download - page 43
Download and view the complete annual report
Please find page 43 of the 1999 Proctor and Gamble annual report below. You can navigate through the pages in the report by either clicking on the pages listed below, or by using the keyword search tool below to find specific information within the annual report.-
 1
1 -
2
-
3
-
4
-
5
-
6
-
7
-
8
-
9
-
10
-
11
-
12
-
13
-
14
-
15
-
16
-
17
-
18
-
19
-
20
-
21
-
22
-
23
-
24
-
25
-
26
-
27
-
28
-
29
-
30
-
31
-
32
-
 33
33 -
 34
34 -
 35
35 -
 36
36 -
 37
37 -
 38
38 -
 39
39 -
 40
40 -
 41
41 -
 42
42 -
 43
43 -
 44
44 -
 45
45 -
 46
46 -
 47
47 -
 48
48 -
 49
49 -
 50
50 -
 51
51 -
 52
52 -
 53
53 -
54
 |
 |

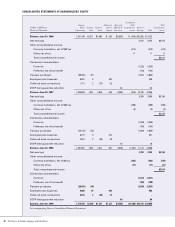
Millions of Dollars Except Per Share Amounts
The Procter & Gamble Company and Subsidiaries
39
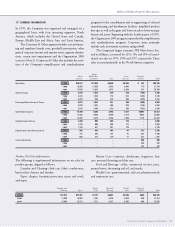
service requirements. Generally, the health care plans require
contributions from retirees and pay a stated percentage of
expenses, reduced by deductibles and other coverages. Retiree
contributions change annually in line with health care cost
trends. These benefits are partially funded by an ESOP, as well
as certain other assets contributed by the Company.
Certain other employees, primarily outside the U.S., are
covered by local defined benefit pension, health care and life
insurance plans.
The elements of the net amount recognized for the
Company’s postretirement plans are summarized below:
Years Ended June 30
Other
Pension Benefits Retiree Benefits
1999 1998 1999 1998
Change in Benefit Obligation
Benefit obligation at
beginning of year $2,282 $1,991 $ 1,465 $ 1,460
Service cost 111 106 49 42
Interest cost 140 148 97 102
Participants’ contributions 4317 11
Amendments (5) 21 (1) (6)
Actuarial loss (gain) 164 87 (356) (71)
Acquisitions 4154 01
Curtailments (3) 13 00
Currency exchange (73) (85) (1) (7)
Benefit payments (136) (156) (71) (67)
Benefit obligation at
end of year 2,488 2,282 1,199 1,465
Change in Plan Assets
Fair value of plan assets
at beginning of year 1,523 1,229 2,611 1,828
Actual return on plan assets 111 243 (49) 803
Acquisitions 4131 00
Employer contributions 95 103 837
Participants’ contributions 4317 11
Currency exchange (46) (30) 0(1)
Benefit payments (136) (156) (71) (67)
Fair value of plan assets
at end of year 1,555 1,523 2,516 2,611
Funded Status
Funded status at end of year (933) (759) 1,317 1,146
Unrecognized net
actuarial loss (gain) 17 (163) (2,384) (2,354)
Unrecognized transition
amount 27 32 00
Unrecognized prior
service cost 37 75 (21) (21)
Net amount recognized (852) (815) (1,088) (1,229)
Prepaid benefit cost $59 $34 $1 $1
Accrued benefit cost (936) (849) (1,089) (1,230)
Accumulated other
comprehensive income 25 000
Net liability recognized (852) (815) (1,088) (1,229)
The Company’s stock comprised $2,346 and $2,443
of other retiree plan assets, net of Series B ESOP debt, as of
June 30, 1999 and 1998, respectively.
Assumptions for the postretirement benefit calculations
are as follows:
Years Ended June 30
Other
Pension Benefits Retiree Benefits
1999 1998 1999 1998
Weighted average
assumptions
Discount rate 6.0% 7.0% 7.5% 6.8%
Expected return
on plan assets 8% 9% 10% 9%
Rate of compensation
increase 5% 5% ––
Initial health care cost
trend rate* ––6% 8%
*Assumed to decrease to 5% by 2006 and remain at that level thereafter.
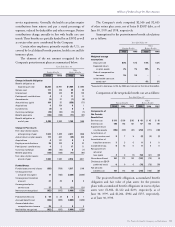
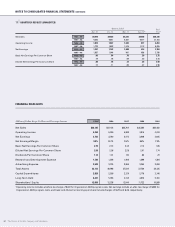
Components of the net periodic benefit cost are as follows:
Years Ended June 30
Other
Pension Benefits Retiree Benefits
1999 1998 1997 1999 1998 1997
Components of
Net Periodic
Benefit Cost
Service cost $ 111 $ 106 $100 $49 $42 $45
Interest cost 140 148 131 97 102 109
Expected return
on plan assets (105) (103) (87) (218) (171) (138)
Amortization of
prior service cost 875(2) (2) (2)
Amortization of
transition amount 330000
Curtailment loss 012 0 000
Recognized net
actuarial
loss (gain) 40 (7) (58) (41) (18)
Gross benefit cost 161 173 142 (132) (70) (4)
Dividends on ESOP
preferred stock 000(78) (78) (79)
Net periodic
benefit cost 161 173 142 (210) (148) (83)
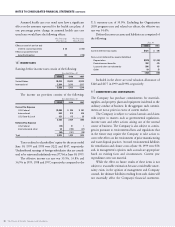
The projected benefit obligation, accumulated benefit
obligation and fair value of plan assets for the pension
plans with accumulated benefit obligations in excess of plan
assets were $1,382, $1,122 and $233, respectively, as of
June 30, 1999, and $1,206, $984 and $155, respectively,
as of June 30, 1998.