Proctor and Gamble 1999 Annual Report Download - page 20
Download and view the complete annual report
Please find page 20 of the 1999 Proctor and Gamble annual report below. You can navigate through the pages in the report by either clicking on the pages listed below, or by using the keyword search tool below to find specific information within the annual report.-
 1
1 -
2
-
3
-
4
-
5
-
6
-
7
-
8
-
9
-
 10
10 -
 11
11 -
 12
12 -
 13
13 -
 14
14 -
 15
15 -
 16
16 -
 17
17 -
 18
18 -
 19
19 -
 20
20 -
 21
21 -
 22
22 -
 23
23 -
 24
24 -
 25
25 -
 26
26 -
 27
27 -
 28
28 -
 29
29 -
 30
30 -
31
-
32
-
33
-
34
-
35
-
36
-
37
-
38
-
39
-
40
-
41
-
42
-
43
-
44
-
45
-
46
-
47
-
48
-
49
-
50
-
51
-
52
-
53
-
54
 |
 |

FINANCIAL REVIEW (CONTINUED)
16
The Procter & Gamble Company and Subsidiaries
Total debt was up $1.33 billion to $9.38 bil-
lion, due to the issuance of commercial paper and
long-term debt to fund share repurchases.
Long-term borrowing available under the
Company’s shelf registration statement filed in
1995, as amended in July 1997, was $1.18 billion
at June 30, 1999. Additionally, the Company has
the ability to issue commercial paper at favorable
rates, and to access general bank financing.
The following pages provide perspective on
the Company’s geographic operating segments.
Geographic segments exclude items that are not
included in measuring business performance, most
notably certain financing and employee benefit
costs, goodwill amortization, corporate elimina-
tions, certain asset write-downs and costs related
to the Company’s Organization 2005 and simpli-
fication and standardization programs.
NORTH AMERICA REGION
The North America region delivered record
results for the fiscal year, spurred by initiative
activity and share growth.
Net sales for the year were $18.98 billion,
an increase of 3% from the prior year level of
$18.46 billion, on broad-based unit volume
growth of 2%. Net sales in 1998 increased 5%
over 1997, on 4% unit volume growth.
Net earnings for the region were up 10% to
$2.71 billion. The region achieved earnings
growth through volume gains, continued focus
on cost control, pricing and value-added ini-
tiatives, particularly in laundry and cleaning
products and in paper. Prior year net earnings
were $2.47 billion, which represented a 10%
increase over 1997. Net earnings margin for the
region was 14.3%, compared to 13.4% and
12.8% in 1998 and 1997, respectively.
The laundry and cleaning sector led the
region’s current year volume progress, generating
5% unit volume growth versus the prior year. The
reformulation of Tide for sanitization and clean
rinse benefits, the launch of Febreze fabric
refresher and strong base business performance
drove volume gains and increased share. Febreze,
introduced late in fiscal 1998, exceeded expecta-
tions, becoming one of the Company’s most
successful brands in terms of introductory year
sales. Laundry and cleaning also performed well
on earnings, delivering half the region’s earnings
improvement behind the introduction of pre-
mium products, pricing and cost savings. In the
prior year, the sector was also a strong contributor,
driving volume and earnings gains.
The paper sector also provided solid volume
and earnings growth, achieving a 2% increase in
unit volume compared to a strong base year.
Tissue and towel posted gains on strength in the
base business, as did feminine protection, behind
the integration of the Tambrands acquisition,
and diapers, behind initiatives. The paper sector
improved sales and earnings ahead of volume, on
the strength of its pricing program and cost
savings, while still investing in initiatives. In 1998,
paper led the region in volume and earnings
progress. Prior year operating results were driven
by the feminine protection business, behind the
acquisition of Tambrands; initiative programs in
diapers; and tissue and towel capacity increases
and pricing strategies.
The health care sector posted a 3% increase
in unit volume versus the prior year. While all
categories delivered positive volume results, phar-
maceuticals made the strongest contribution by
increasing share on all major brands. The sector
attained excellent earnings progress behind the
shift toward higher-margin pharmaceutical sales
and pricing, mitigated by increased support for
upcoming initiative launches. In 1998, the sector’s
unit volume fell slightly, as improved volume in
pharmaceuticals only partially offset oral care
declines related to heavy competition. Prior year
earnings declined over 1997 due to a continued
investment in research and development, primarily
in pharmaceuticals, and in marketing support to
combat competition in oral care. The sector’s high
level of investment in research and development
has resulted in a strong pipeline of new phar-
maceutical products, while setting the stage for
innovations in other health care products in the
years to come.
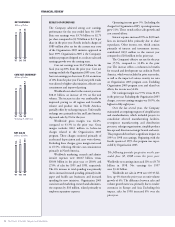
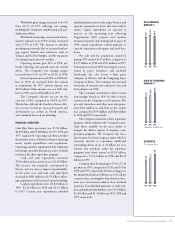
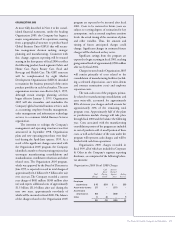
5.9
4.9
5.5
’97 ’98 ’99
OPERATING CASH FLOW
Billions of Dollars
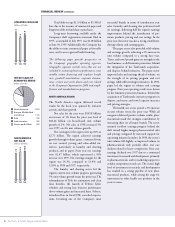
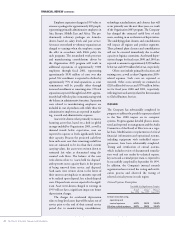
North America 19.0
Europe, Middle East
and Africa 11.9
Asia 3.6
Latin America 2.8
Corporate & Other 0.8
1999 NET SALES BY
GEOGRAPHIC REGION
Billions of Dollars
17.6
18.5
19.0
’97 ’98 ’99
NORTH AMERICA
NET SALES
Billions of Dollars