Proctor and Gamble 1999 Annual Report Download - page 18
Download and view the complete annual report
Please find page 18 of the 1999 Proctor and Gamble annual report below. You can navigate through the pages in the report by either clicking on the pages listed below, or by using the keyword search tool below to find specific information within the annual report.-
 1
1 -
2
-
3
-
4
-
5
-
6
-
7
-
 8
8 -
 9
9 -
 10
10 -
 11
11 -
 12
12 -
 13
13 -
 14
14 -
 15
15 -
 16
16 -
 17
17 -
 18
18 -
 19
19 -
 20
20 -
 21
21 -
 22
22 -
 23
23 -
 24
24 -
 25
25 -
 26
26 -
 27
27 -
 28
28 -
29
-
30
-
31
-
32
-
33
-
34
-
35
-
36
-
37
-
38
-
39
-
40
-
41
-
42
-
43
-
44
-
45
-
46
-
47
-
48
-
49
-
50
-
51
-
52
-
53
-
54
 |
 |

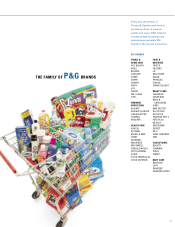
FINANCIAL REVIEW
14
The Procter & Gamble Company and Subsidiaries
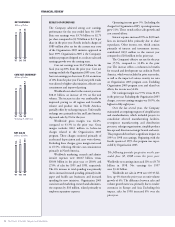
RESULTS OF OPERATIONS
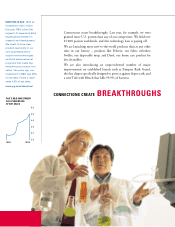
The Company achieved strong core earnings
performance for the year ended June 30, 1999.
Basic net earnings were $3.76 billion or $2.75
per share compared to $3.78 billion or $2.74 per
share in the prior year. Results include charges of
$385 million after tax for the current year costs
of the Organization 2005 initiative approved in
June 1999. Organization 2005 is the Company’s
multiyear program designed to accelerate sales and
earnings growth over the coming years.
Core net earnings were $4.15 billion for the
fiscal year, up 10% from the prior year. Core net
earnings exclude the Organization 2005 costs. Core
basic net earnings per share were $3.04, an increase
of 11% from the prior year. Fiscal year profit results
were driven by higher value initiatives, effective cost
containment and improved pricing.
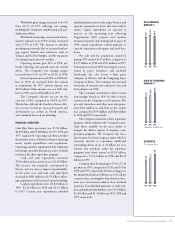
Worldwide net sales for the current year were
$38.13 billion, an increase of 3% on flat unit
volume. The increase in sales was attributable to
improved pricing in all regions and favorable
volume and product mix in North America,
partially offset by exchange impacts. Unfavorable
exchange rates, primarily in Asia and Latin America,
depressed sales by 1% for the year.
Worldwide gross margin was 44.4%,
compared to 43.3% in the prior year. Gross
margin includes $443 million in before-tax
charges related to the Organization 2005
program. These charges consisted primarily of
accelerated depreciation and asset write-downs.
Excluding these charges, gross margin increased
to 45.5%, reflecting effective cost containment,
primarily in North America.
Worldwide marketing, research and admin-
istrative expenses were $10.67 billion, versus
$10.04 billion in the prior year, or 28.0% and
27.0% of sales for 1999 and 1998, respectively.
The 6% increase in total spending was primarily
due to increased research spending, primarily in the
paper and health care businesses, and increased
spending for new initiatives. Organization 2005
costs increased marketing, research and administra-
tive expenses by $38 million, related primarily to
employee separation expenses.
Operating income grew 3%. Excluding the
charges for Organization 2005, operating income
grew 11%. These trends reflect sales growth and
cost control efforts.
Interest expense increased 19% to $650 mil-
lion on increased debt, primarily due to share
repurchases. Other income, net, which consists
primarily of interest and investment income,
contributed $235 million in the current year
compared to $201 million in the prior year.
The Company’s effective tax rate for the year
was 35.5%, compared to 33.8% in the prior
year. The increase reflects a reduction in benefits
for research and development tax credits in North
America, which were included in prior year results,
as well as the impact of various country tax rates
on Organization 2005 program costs. Excluding
Organization 2005 program costs and related tax
effects, the tax rate was 34.4%.
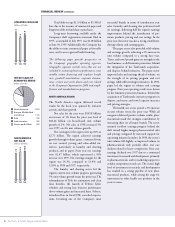
Net earnings margin was 9.9% versus 10.2%
in the prior year. Excluding the Organization 2005
charges, core net earnings margin was 10.9%, the
highest in fifty-eight years.
Over the last several years, the Company
maintained an ongoing program of simplification
and standardization, which included projects to
consolidate selected manufacturing facilities,
re-engineer manufacturing and distribution
processes, redesign organizations, simplify product
line-ups and divest non-strategic brands and assets.
This program did not have a significant impact on
1999 or 1998 net earnings. Beginning with the
fourth quarter of 1999, this program was super-
seded by Organization 2005.
The following provides perspective on the year
ended June 30, 1998 versus the prior year:
Worldwide net earnings increased 11% to $3.78
billion in 1998. Net earnings for 1997
were $3.42 billion.
Worldwide net sales in 1998 were $37.15 bil-
lion, up 4% from the prior year on unit volume
growth of 6%. The difference between sales and
volume growth rates was primarily due to weaker
currencies in Europe and Asia. Excluding this
impact, sales for 1998 increased 8% over the
prior year.
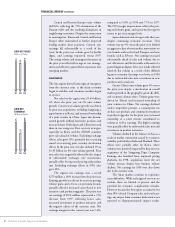
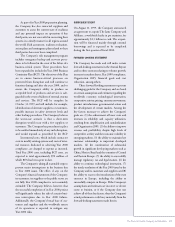
3.4
3.8
3.8
’97 ’98 ’99
NET EARNINGS
Billions of Dollars
3.4
3.8
4.2
’97 ’98 ’99
CORE NET EARNINGS*
Billions of Dollars
*Excluding O-2005 Costs
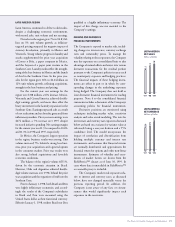
35.8
37.2
38.1
’97 ’98 ’99
NET SALES
Billions of Dollars