Proctor and Gamble 1999 Annual Report Download - page 31
Download and view the complete annual report
Please find page 31 of the 1999 Proctor and Gamble annual report below. You can navigate through the pages in the report by either clicking on the pages listed below, or by using the keyword search tool below to find specific information within the annual report.-
 1
1 -
2
-
3
-
4
-
5
-
6
-
7
-
8
-
9
-
10
-
11
-
12
-
13
-
14
-
15
-
16
-
17
-
18
-
19
-
20
-
 21
21 -
 22
22 -
 23
23 -
 24
24 -
 25
25 -
 26
26 -
 27
27 -
 28
28 -
 29
29 -
 30
30 -
 31
31 -
 32
32 -
 33
33 -
 34
34 -
 35
35 -
 36
36 -
 37
37 -
 38
38 -
 39
39 -
 40
40 -
 41
41 -
42
-
43
-
44
-
45
-
46
-
47
-
48
-
49
-
50
-
51
-
52
-
53
-
54
 |
 |

The Procter & Gamble Company and Subsidiaries
27
The Procter & Gamble Company and Subsidiaries
27
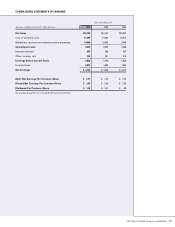
CONSOLIDATED STATEMENTS OF EARNINGS
Years Ended June 30
Amounts in Millions Except Per Share Amounts 1999 1998 1997
Net Sales $38,125 $37,154 $35,764
Cost of products sold 21,206 21,064 20,510
Marketing, research and administrative expenses 10,666 10,035 9,766
Operating Income 6,253 6,055 5,488
Interest expense 650 548 457
Other income, net 235 201 218
Earnings Before Income Taxes 5,838 5,708 5,249
Income taxes 2,075 1,928 1,834
Net Earnings $ 3,763 $ 3,780 $ 3,415
Basic Net Earnings Per Common Share $ 2.75 $ 2.74 $ 2.43
Diluted Net Earnings Per Common Share $ 2.59 $ 2.56 $ 2.28
Dividends Per Common Share $ 1.14 $ 1.01 $ .90
See accompanying Notes to Consolidated Financial Statements.