Proctor and Gamble 1999 Annual Report Download - page 34
Download and view the complete annual report
Please find page 34 of the 1999 Proctor and Gamble annual report below. You can navigate through the pages in the report by either clicking on the pages listed below, or by using the keyword search tool below to find specific information within the annual report.-
 1
1 -
2
-
3
-
4
-
5
-
6
-
7
-
8
-
9
-
10
-
11
-
12
-
13
-
14
-
15
-
16
-
17
-
18
-
19
-
20
-
21
-
22
-
23
-
 24
24 -
 25
25 -
 26
26 -
 27
27 -
 28
28 -
 29
29 -
 30
30 -
 31
31 -
 32
32 -
 33
33 -
 34
34 -
 35
35 -
 36
36 -
 37
37 -
 38
38 -
 39
39 -
 40
40 -
 41
41 -
 42
42 -
 43
43 -
 44
44 -
45
-
46
-
47
-
48
-
49
-
50
-
51
-
52
-
53
-
54
 |
 |

30
The Procter & Gamble Company and Subsidiaries
30
The Procter & Gamble Company and Subsidiaries
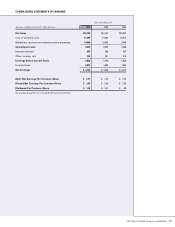
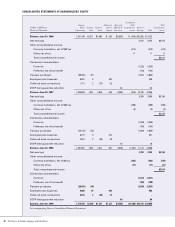
CONSOLIDATED STATEMENTS OF SHAREHOLDERS’ EQUITY
Accumulated
Common Additional Reserve for Other Total
Dollars in Millions/
Shares Common Preferred Paid-in ESOP Debt Comprehensive Retained Comprehensive
Shares in Thousands
Outstanding Stock Stock Capital Retirement Income Earnings Total Income
Balance June 30, 1996 1,371,146 $1,371 $1,886 $ 294 $(1,676) $ (418) $10,265 $11,722
Net earnings 3,415 3,415 $3,415
Other comprehensive income:
Currency translation, net of $38 tax (412) (412) (412)
Other, net of tax 11 11 11
Total comprehensive income $3,014
Dividends to shareholders:
Common (1,225) (1,225)
Preferred, net of tax benefit (104) (104)
Treasury purchases (30,875) (31) (1,621) (1,652)
Employee plan issuances 8,801 9 240 249
Preferred stock conversions 1,771 2 (27) 25 –
ESOP debt guarantee reduction 42 42
Balance June 30, 1997 1,350,843 1,351 1,859 559 (1,634) (819) 10,730 12,046
Net earnings 3,780 3,780 $3,780
Other comprehensive income:
Currency translation, net of $25 tax (536) (536) (536)
Other, net of tax (2) (2) (2)
Total comprehensive income $3,242
Dividends to shareholders:
Common (1,358) (1,358)
Preferred, net of tax benefit (104) (104)
Treasury purchases (24,716) (25) (1,904) (1,929)
Employee plan issuances 8,777 9 312 321
Preferred stock conversions 2,557 2 (38) 36 –
ESOP debt guarantee reduction 18 18
Balance June 30, 1998 1,337,461 1,337 1,821 907 (1,616) (1,357) 11,144 12,236
Net earnings 3,763 3,763 $3,763
Other comprehensive income:
Currency translation, net of $4 tax (232) (232) (232)
Other, net of tax (17) (17) (17)
Total comprehensive income $3,514
Dividends to shareholders:
Common (1,517) (1,517)
Preferred, net of tax benefit (109) (109)
Treasury purchases (29,924) (30) (2,503) (2,533)
Employee plan issuances 9,605 10 393 403
Preferred stock conversions 2,612 3 (40) 37 –
ESOP debt guarantee reduction 64 64
Balance June 30, 1999 1,319,754 $1,320 $1,781 $1,337 $(1,552) $(1,606) $10,778 $12,058
See accompanying Notes to Consolidated Financial Statements.