North Face 2004 Annual Report Download - page 38
Download and view the complete annual report
Please find page 38 of the 2004 North Face annual report below. You can navigate through the pages in the report by either clicking on the pages listed below, or by using the keyword search tool below to find specific information within the annual report.-
 1
1 -
2
-
3
-
4
-
5
-
6
-
7
-
8
-
9
-
10
-
11
-
12
-
13
-
14
-
15
-
16
-
17
-
18
-
19
-
20
-
21
-
22
-
23
-
24
-
25
-
26
-
27
-
 28
28 -
 29
29 -
 30
30 -
 31
31 -
 32
32 -
 33
33 -
 34
34 -
 35
35 -
 36
36 -
 37
37 -
 38
38 -
 39
39 -
 40
40 -
 41
41 -
 42
42 -
 43
43 -
 44
44 -
 45
45 -
 46
46 -
 47
47 -
 48
48 -
49
-
50
-
51
-
52
-
53
-
54
-
55
-
56
-
57
-
58
 |
 |
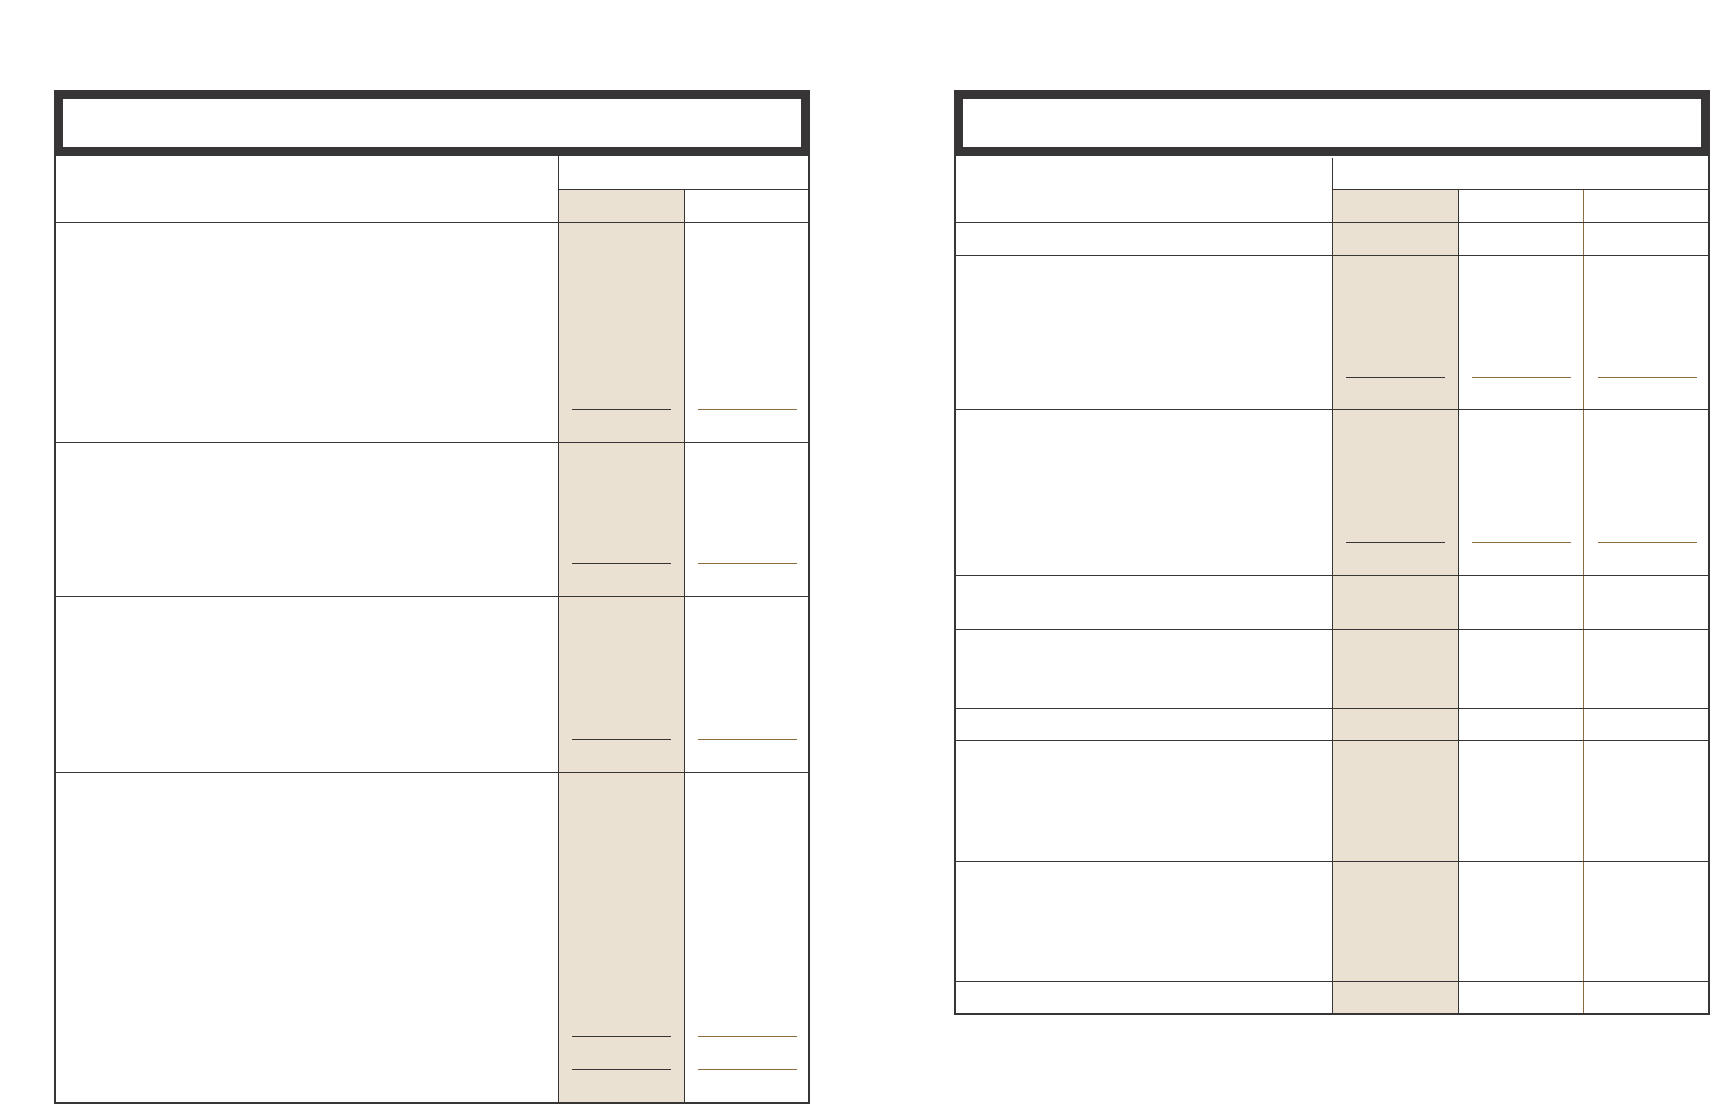
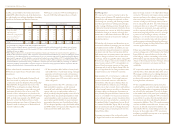
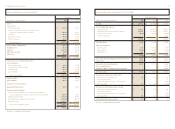
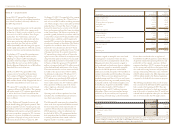
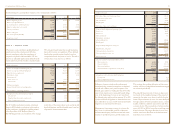
71vf corporation 2004 Annual Report
Year Ended December
In thousands, except per share amounts 2004 2003 2002
Net Sales $6,054,536 $ 5,207,459 $ 5,083,523
Costs and Operating Expenses
Cost of goods sold 3,644,255 3,262,375 3,254,008
Marketing, administrative and general expenses 1,676,769 1,331,814 1,229,902
Royalty income and other (44,276) (31,619) (24,587)
Goodwill impairment – – 2,276
5,276,748 4,562,570 4,461,599
Operating Income 777,788 644,889 621,924
Other Income (Expense)
Interest income 7,151 11,456 7,397
Interest expense (76,087) (61,368) (71,325)
Miscellaneous, net 3,268 3,529 3,732
(65,668) (46,383) (60,196)
Income from Continuing Operations before Income Taxes 712,120 598,506 561,728
Income Taxes 237,418 200,573 197,300
Income from Continuing Operations 474,702 397,933 364,428
Discontinued Operations –– 8,283
Cumulative Effect of a Change in Accounting Policy –– (527,254)
Net Income (Loss) $ 474,702 $ 397,933 $ (154,543)
Earnings (Loss) Per Common Share– Basic
Income from continuing operations $4.30 $ 3.67 $ 3.26
Discontinued operations ––.08
Cumulative effect of a change in accounting policy ––(4.83)
Net income (loss) 4.30 3.67 (1.49)
Earnings (Loss) Per Common Share– Diluted
Income from continuing operations $4.21 $ 3.61 $ 3.24
Discontinued operations ––.07
Cumulative effect of a change in accounting policy ––(4.69)
Net income (loss) 4.21 3.61 (1.38)
Cash Dividends Per Common Share $1.05 $ 1.01 $ .97
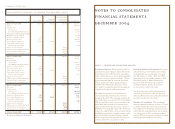
See notes to consolidated financial statements.
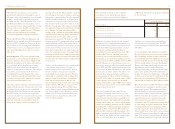
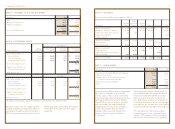
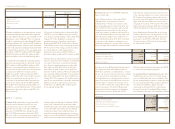
December
In thousands, except share amounts 2004 2003
assets
Current Assets
Cash and equivalents $ 485,507 $ 514,785
Accounts receivable, less allowance for doubtful accounts
of $60,790 in 2004 and $65,769 in 2003 751,582 633,863
Inventories 973,248 932,985
Deferred income taxes 99,338 92,828
Other current assets 68,893 34,070
Total current assets 2,378,568 2,208,531
Property, Plant and Equipment 572,254 591,680
Intangible Assets 639,520 318,634
Goodwill 1,031,594 700,972
Deferred Income Taxes 12,476 117,436
Other Assets 369,866 308,299
$5,004,278 $ 4,245,552
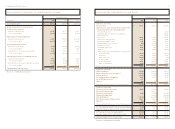
liabilities and stockholders’ equity
Current Liabilities
Short-term borrowings $ 42,830 $ 33,948
Current portion of long-term debt 401,232 1,144
Accounts payable 369,937 315,219
Accrued liabilities 558,215 438,939
Total current liabilities 1,372,214 789,250
Long-term Debt 556,639 956,383
Other Liabilities 536,131 518,625
Commitments and Contingencies
Redeemable Preferred Stock 26,053 29,987
Common Stockholders’ Equity
Common Stock, stated value $1; shares authorized, 300,000,000;
shares outstanding, 111,388,353 in 2004 and 108,170,091 in 2003 111,388 108,170
Additional paid-in capital 1,087,641 964,990
Accumulated other comprehensive income (loss) (113,071) (189,455)
Retained earnings 1,427,283 1,067,602
Total common stockholders' equity 2,513,241 1,951,307
$5,004,278 $ 4,245,552
See notes to consolidated financial statements.
consolidated balance sheets consolidated statements of income