North Face 2004 Annual Report Download - page 29
Download and view the complete annual report
Please find page 29 of the 2004 North Face annual report below. You can navigate through the pages in the report by either clicking on the pages listed below, or by using the keyword search tool below to find specific information within the annual report.-
 1
1 -
2
-
3
-
4
-
5
-
6
-
7
-
8
-
9
-
10
-
11
-
12
-
13
-
14
-
15
-
16
-
17
-
18
-
 19
19 -
 20
20 -
 21
21 -
 22
22 -
 23
23 -
 24
24 -
 25
25 -
 26
26 -
 27
27 -
 28
28 -
 29
29 -
 30
30 -
 31
31 -
 32
32 -
 33
33 -
 34
34 -
 35
35 -
 36
36 -
 37
37 -
 38
38 -
 39
39 -
40
-
41
-
42
-
43
-
44
-
45
-
46
-
47
-
48
-
49
-
50
-
51
-
52
-
53
-
54
-
55
-
56
-
57
-
58
 |
 |

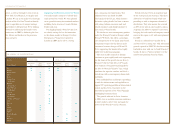
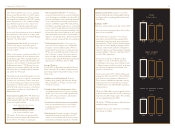
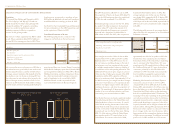
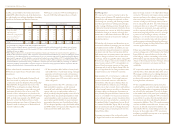
21.2 22.3 22.1
2004 2003 2002
1.05 1.01 .97
2004 2003 2002
53vf corporation 2004 Annual Report
The remaining 0.2% of the increase was due to lower
sales volume in our core businesses without a propor-
tionate decline in expenses.
Operating results in 2004 included $40 million of
expense (0.7% of net sales) related to growth and
cost reduction initiatives. Of this total, approximately
$36 million related to Marketing, Administrative and
General Expenses, with the balance related to Cost
of Goods Sold. Approximately 40% of this spending
related to new or expanded advertising programs and
market research associated with our Nautica® and
other brands. Approximately 45% of the spending
related to cost reduction actions and consulting
related to future cost reduction opportunities. For
example, we entered into an information technology
outsourcing agreement with a major third party
service provider, and we incurred charges for the
closure of a production plant and for consolidation
of distribution centers. And finally, approximately
10% of the spending related to additional positions
to drive growth. We added four new executive posi-
tions, and will be adding supporting staff positions,
dedicated to working more closely with our major
customers, driving increased strategic planning
for brand development and pursuing targeted
acquisition efforts.
We include cooperative advertising, retail store
and distribution costs in Marketing, Administrative
and General Expenses, as stated in our significant
accounting policies in Note A to the Consolidated
Financial Statements. Some other companies may
classify cooperative advertising costs as a reduction
of Net Sales, while some may classify retail store and
distribution costs in Cost of Goods Sold. Accordingly,
our gross margins and operating expenses may not be
directly comparable with those companies.
Royalty Income and Other increased by $12.7 million
in 2004 and $7.0 million in 2003. Net royalty income
was $49.9 million in 2004, $28.6 million in 2003
and $20.5 million in 2002. The increase in both years
was primarily from higher levels of licensing activity
related to Nautica, acquired in August 2003. Also
included in this caption is $9.5 million of net charges
related to the disposition of VF Playwear in 2004.
Goodwill Impairment consisted of a charge of $2.3
million in our VF Playwear reporting unit in 2002
based on a revised forecast of its profits and cash flows.
Interest Expense (including amortization of debt
discount, debt issuance costs and gain/loss on interest
rate hedging contracts) increased by $14.7 million
in 2004 and decreased by $10.0 million in 2003. The
increase in 2004 was primarily due to higher average
borrowings, and the decrease in 2003 was primarily
due to lower average interest rates. Average interest-
bearing debt outstanding totaled approximately
$1,050 million for 2004, $810 million for 2003 and
$770 million for 2002. The weighted average interest
rate was 7.0% for 2004, 7.3% for 2003 and 8.1% for
2002. Interest Income in 2003 included $5.7 million
related to the settlement of federal income tax issues.
The effective income tax rate for continuing opera-
tions was 33.3% in 2004, compared with 33.5% in
2003 and 35.1% in 2002. The effective income tax
rate declined in 2004 relative to 2003 primarily due
to increased income in international jurisdictions that
was taxed at lower rates. The effective tax rate declined
in 2003 relative to the prior year due to (1) higher
nontaxable income related to investments held for
employee benefit plans, (2) lower foreign operating
losses with no related tax benefit and (3) favorable
settlements in 2003 of prior years’ federal and state
income tax returns.
Income from continuing operations was $474.7 million
($4.21 per share) in 2004. This compares with income
from continuing operations of $397.9 million ($3.61
per share) in 2003 and $364.4 million ($3.24 per
share) in 2002. Income from continuing operations
increased 19% in 2004, while earnings per share
increased 17%, reflecting a larger number of shares
outstanding due to exercises of stock options. In 2003,
income from continuing operations increased 9% over
the prior year, while earnings per share increased 11%,
reflecting the benefit of shares repurchased during
2003 and 2002. In translating foreign currencies into
the U.S. dollar, the weaker U.S. dollar had a $0.09
favorable impact on earnings per share in 2004
compared with the prior year and a $0.14 favorable
impact in 2003 compared with the prior year. The
2004 Acquisitions had a $0.14 favorable impact on
2004 operating results, and the acquisition of Nautica
in 2003 had a $0.16 per share favorable impact on
2003 results.
In 2002, VF exited the Private Label Knitwear and
the Jantzen swimwear businesses. Both businesses met
the criteria for treatment as discontinued operations.
Accordingly, their operating results and cash flows
are separately presented as discontinued operations in
the accompanying consolidated financial statements.
During 2002, these businesses contributed net income
of $8.3 million ($0.07 per share), primarily due to
gains on disposal of real estate.
VF adopted FASB Statement No. 142, Goodwill and
Other Intangible Assets, at the beginning of 2002.
In adopting this Statement, we estimated the fair value
of our individual business reporting units on a
discounted cash flow basis. This evaluation, and the
related valuation of net assets of each reporting unit,
indicated that recorded Goodwill exceeded its fair
value at several business units where performance had
not met management’s expectations established at
their acquisition dates. More specifically, the European
intimate apparel, childrenswear, occupational apparel
and licensed sportswear business units had been
profitable in prior years but at a lower level than
anticipated at the dates of their respective acquisitions.
The Latin American jeanswear business units had not
been profitable due to deteriorating economic condi-
tions in South America, but profitability was expected
in the future. In each case, recorded Goodwill was
expected to be recoverable from future undiscounted
operating cash flows. The write-down of Goodwill
upon adoption of this Statement was attributable to
differences between the fair value approach under this
Statement and the undiscounted cash flow approach
used under previous accounting literature. The adop-
tion of this Statement resulted in a noncash charge of
$527.3 million in 2002, without tax benefit ($4.69 per
share). See Note A to the Consolidated Financial
Statements for additional details.
VF reported net income of $474.7 million ($4.21
per share) in 2004, compared with $397.9 million
($3.61 per share) in 2003. Including the effect of
the above accounting change and the discontinued
operations discussed in the preceding paragraphs,
VF reported a net loss of $154.5 million ($1.38
per share) in 2002.
dividends per share
(Dollars)
return on average common equity
(Percent)