North Face 2004 Annual Report Download - page 28
Download and view the complete annual report
Please find page 28 of the 2004 North Face annual report below. You can navigate through the pages in the report by either clicking on the pages listed below, or by using the keyword search tool below to find specific information within the annual report.-
 1
1 -
2
-
3
-
4
-
5
-
6
-
7
-
8
-
9
-
10
-
11
-
12
-
13
-
14
-
15
-
16
-
17
-
 18
18 -
 19
19 -
 20
20 -
 21
21 -
 22
22 -
 23
23 -
 24
24 -
 25
25 -
 26
26 -
 27
27 -
 28
28 -
 29
29 -
 30
30 -
 31
31 -
 32
32 -
 33
33 -
 34
34 -
 35
35 -
 36
36 -
 37
37 -
 38
38 -
39
-
40
-
41
-
42
-
43
-
44
-
45
-
46
-
47
-
48
-
49
-
50
-
51
-
52
-
53
-
54
-
55
-
56
-
57
-
58
 |
 |

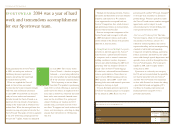
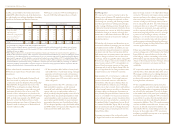
730
544
646
2004 2003 2002
15.8 16.6 16.9
2004 2003 2002
return on capital
(Percent)
51vf corporation 2004 Annual Report
Acquisitions
VF acquired Vans, Kipling and Napapijri in 2004.
The Vans®,Kipling® and Napapijri® brands are
lifestyle brands that we believe have global growth
potential. In addition, VF acquired a controlling
interest in a newly formed intimate apparel
marketing company in Mexico to expand our
presence in that growing market.
The total cost of these acquisitions was $667.5 million
in cash. These acquisitions added $303.0 million to
sales and $0.14 to earnings per share in 2004. These
four businesses are expected to contribute at least
$200 million in additional sales and could contribute
an additional $0.14 to earnings per share in 2005.
See Note B to the Consolidated Financial Statements
for more information on the 2004 Acquisitions and
on the acquisition of Nautica in 2003.
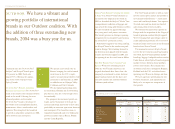
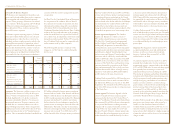
Consolidated Statements of Income
The following table presents a summary of the
changes in our Net Sales in the last two years:
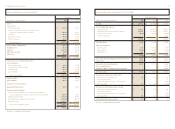
analysis of results of continuing operations
2004 Compared 2003 Compared
In millions with 2003 with 2002
Net sales – prior year $ 5,207 $ 5,084
Core businesses 235 (110)
Acquisitions in prior year (to anniversary date) 367 –
Acquisitions in current year 303 264
Disposition of VF Playwear (57) (31)
Net sales – current year $ 6,055 $ 5,207
Sales increased in most core businesses in 2004 due to
unit volume increases, particularly in our outdoor and
intimate apparel businesses, and the favorable effects
of foreign currency translation. Substantially all of the
sales decline in our core businesses during 2003 was
due to decreases in unit volume, offset in part by the
effects of foreign currency translation. Sales in core
businesses in 2003 declined by $126 million resulting
from two major customers operating under bankruptcy
protection and their store closures: Kmart Corporation,
which filed for bankruptcy protection in January 2002
and emerged from bankruptcy in May 2003 as Kmart
Holding Corporation, and Ames Department Stores,
Inc., which operated under bankruptcy protection
until its liquidation in the second half of 2002.
Additional details on sales are provided in the
section titled Information by Business Segment.
The 2004 Acquisitions added 6% to sales in 2004.
The acquisition of Nautica in August 2003 added 7%
(prior to the 2004 anniversary date of its acquisition)
to 2004 sales and contributed 5% to 2003 sales.
In translating foreign currencies into the U.S. dollar,
the weaker U.S. dollar in relation to the functional
currencies where VF conducts the majority of its
business (primarily the European euro countries)
improved sales comparisons by $96 million in
2004 relative to 2003. For 2003, sales comparisons
benefited by $128 million relative to 2002. The
average translation rate for the euro was $1.23 per
euro during 2004, compared with $1.12 during 2003
and $0.94 during 2002. Based on the translation rate
of $1.36 per euro at the end of 2004, reported sales in
2005 may also receive a translation benefit compared
with 2004.
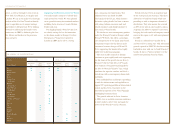
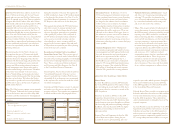
The following table presents the percentage relation-
ship to Net Sales for components of our Consolidated
Statements of Income:
2004 2003 2002
Gross margin (net sales less cost of goods sold) 39.8%37.4%36.0%
Marketing, administrative and general expenses (27.7) (25.6) (24.2)
Royalty income and other 0.7 0.6 0.4
Operating income 12.8%12.4%12.2%
Gross margins increased to 39.8% of sales in 2004,
compared with 37.4% in 2003 and 36.0% in 2002.
Approximately 1.8% of the 2004 increase was in
our core businesses, including changes in the mix of
our businesses as we have experienced sales growth
in our higher margin outdoor businesses, benefits of
cost reduction actions and operating efficiencies. The
additional 0.6% increase in gross margin as a percent
of sales was due to higher gross margins of the 2004
Acquisitions and the 2003 acquisition of Nautica
(prior to its anniversary date). Approximately 1.0% of
the 2003 increase in gross margin was due to changes
in the mix of our businesses, as we experienced sales
growth in our higher margin outdoor and interna-
tional jeans businesses, and from the acquisition of
Nautica. The remaining 0.4% improvement related to
benefits of our cost reduction initiatives and lower
restructuring costs incurred relative to 2002.
Over the last five years, we closed a significant number
of manufacturing facilities in the United States and
shifted production to lower cost sources. As a result
of this shift in sourcing, the amount of sales in the
United States derived from products manufactured
in lower cost locations outside the United States has
increased each year over the last three years. During
2004, 3% of the units we sold in the United States
were manufactured in VF-owned plants in the
United States. In contrast, at the end of 2000,
approximately one-third of our products sold in the
United States were manufactured in our United
States plants. Today, of the total products supporting
sales to customers in the United States, 38% were
manufactured in VF-owned facilities in Mexico and
the Caribbean Basin and 59% were obtained from
contractors, primarily in Asia. We believe this
combination of VF-owned and contracted produc-
tion from different geographic regions provides
a competitive advantage in our product sourcing.
Marketing, Administrative and General Expenses
increased as a percent of sales to 27.7% in 2004,
compared with 25.6% in 2003 and 24.2% in 2002.
During 2004, approximately 1.4% of the increase was
due to the higher cost to sales relationship of the 2004
Acquisitions and Nautica (prior to the anniversary
date of its acquisition) than other VF businesses. The
remaining 0.7% is due to spending on the growth and
cost reduction initiatives discussed in the following
paragraph, increased incentive compensation expense
and increased advertising as a percent of sales, offset
in part by favorable effects of higher volume and cost
reduction efforts. During 2003, approximately 0.7% of
the increase in these expenses as a percent of sales was
due to changes in the mix of our businesses, with a
larger portion of sales coming from businesses having
a higher expense percentage. In addition, increased
pension cost in 2003 resulted in a 0.5% increase.
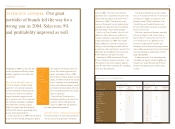
cash provided by operations
(Dollars in millions)