Navy Federal Credit Union 2006 Annual Report Download - page 25
Download and view the complete annual report
Please find page 25 of the 2006 Navy Federal Credit Union annual report below. You can navigate through the pages in the report by either clicking on the pages listed below, or by using the keyword search tool below to find specific information within the annual report.-
 1
1 -
2
-
3
-
4
-
5
-
6
-
7
-
8
-
9
-
10
-
11
-
12
-
13
-
14
-
 15
15 -
 16
16 -
 17
17 -
 18
18 -
 19
19 -
 20
20 -
 21
21 -
 22
22 -
 23
23 -
 24
24 -
 25
25 -
 26
26 -
 27
27
 |
 |

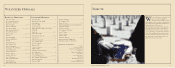
13
12
N : M’ A
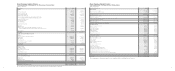
Member deposit accounts as of December 31, 2006 and 2005 were summarized as follows (dollars in thousands):
e total uninsured amount of members’ accounts was $2.86 billion and $2.53 billion at December 31, 2006 and 2005, respectively.
At December 31, 2006, scheduled maturities of share certificates and IRA certificates were as follows (dollars in thousands):
Total dividends on members’ deposit accounts were as follows (dollars in thousands):
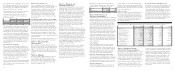
N : R B P
Navy Federal Credit Union Employees’ Retirement Plan
is is a defined benefit retirement plan which means that
benefits are based on a set formula. Navy Federal’s plan
converted to a Cash Balance Plan design as of 1 January
2001, but still retains the Traditional Plan design for those
employees who opted to remain in the Traditional Plan.
e following describes how the benefits are calculated:
• Cash Balance Plan–is plan provides either a single
sum payment upon retirement or a monthly annuity
option depending on the amount of the accrued benefit.
• Traditional Plan–is plan is designed to provide a
lifetime of monthly retirement benefits, determined
by a set formula, to vested employees. e formula is
based on the final average earnings (average from the
three highest consecutive years of income) multiplied by
2% multiplied by the length of service.
Retiree Medical Plan
Navy Federal provides postretirement benefits to retired
employees in the form of a contributory group medical plan
and supplemental retirement income to offset the cost of med-
ical insurance premiums or out-of-pocket medical expenses
(Medical Plan). Under the provisions of the Medical Plan, the
retirees are responsible for the full payment of the medical
insurance premiums. e supplemental retirement income
benefit is an annual benefit of $75 multiplied by the number of
years of continuous service the retiree had with Navy Federal.
ere are no assets set aside to pre-fund the liability associated
with the Medical Plan.
Weighted
Average Rate
for 2006
Amount at
December 31, 2006
Weighted
Average Rate
for 2005 Amount at
December 31, 2005
Money market 4.29% $ 3,061,374 2.48% $ 2,142,609
Share savings 1.26% 5,186,140 1.26% 6,070,407
Member escrow 0.48% 82,497 0.48% 79,853
Checking 0.50% 3,248,313 0.50% 3,173,550
Share and IRA certificates 4.57% 8,629,856 4.06% 6,894,307
IRA shares 1.63% 412,701 1.48% 474,127
Investor custodial accounts 0.00% 85,207 0.00% 105,422
Total deposits $ 20,706,088 $ 18,940,275
Years Ending December 31
2007 2008 2009 2010 2011 ereafter
0–2.00% $ 5,496 $ 620 $ 355 $ 209 $ 101 $–
2.01 – 3.00 3,757 – – – – –
3.01 – 4.00 544,923 175,731 11 – – –
4.01 – 5.00 1,377,686 835,349 1,442,365 701,586 – –
5.01 – 6.00 843,392 188,521 296,635 28,110 338,294 231,155
6.01 – 7.00 33 1,615,409 – 95 – 7
7.01 – 8.00% 16 – – – – –
Total $ 2,775,303 $ 2,815,630 $ 1,739,366 $ 730,000 $ 338,395 $ 231,162
2006 2005
Money market $ 112,267 $ 45,222
Share savings 78,671 76,409
Checking 13,784 12,998
Share and IRA certificates 340,377 270,519
IRA shares 7,129 7,120
Total dividends $ 552,228 $ 412,268
Medical cost trends do not impact the determination of the postretirement benefit, as the
benefit amount is a fixed monthly amount based on the number of years of continuous service.
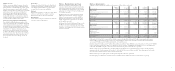
e following table sets forth the funded status of the pension and other
postretirement plans (dollars in thousands):
e weighted-average assumptions used to determine the projected benefit obligation for
the pension and other postretirement benefits were:
e following table sets forth the net benefit cost, contributions received and benefits paid
for the benefit plans (dollars in thousands):
e weighted-average assumptions used to determine the net periodic benefit cost for the
pension and other postretirement benefits were:
e following table discloses the benefits expected to be paid in the next ten years
(dollars in thousands):
Pension Benefits Retiree Medical
2006 2005 2006 2005
Benefit obligation $ 424,799 $ 388,720 $ 20,424 $ 18,923
Fair value of plan assets 472,488 360,679 ––
Funded status 47,689 (28,041) (20,424) (18,923)
Pension Benefits Retiree Medical
2006 2005 2006 2005
Discount rate 5.95% 5.50% 5.95% 5.50%
Rate of compensation increase 5.00% 4.50% ––
Pension Benefits Retiree Medical
2006 2005 2006 2005
Benefit cost $ 19,765 $ 14,809 $ 2,888 $ 2,499
Employer contribution 69,795 34,671 1,155 203
Plan participants’ contributions ––––
Benefits paid 10,530 8,648 1,155 203
Pension Benefits Retiree Medical
2006 2005 2006 2005
Discount rate 5.50% 5.75% 5.50% 5.75%
Expected return on plan assets 8.75% 8.75% ––
Rate of compensation increase 4.50% 4.50% ––
Pension Retiree Medical
2007 $ 13,555 $ 643
2008 15,059 721
2009 16,534 809
2010 18,233 907
2011 19,825 1,011
2012–2016 137,090 6,904
Total benefits expected, next ten years $ 220,296 $ 10,995