National Grid 2012 Annual Report Download - page 7
Download and view the complete annual report
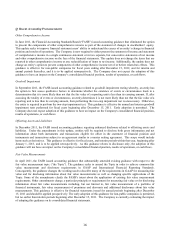
Please find page 7 of the 2012 National Grid annual report below. You can navigate through the pages in the report by either clicking on the pages listed below, or by using the keyword search tool below to find specific information within the annual report.-
 1
1 -
 2
2 -
 3
3 -
 4
4 -
 5
5 -
 6
6 -
 7
7 -
 8
8 -
 9
9 -
 10
10 -
 11
11 -
 12
12 -
 13
13 -
 14
14 -
 15
15 -
 16
16 -
 17
17 -
 18
18 -
19
-
20
-
21
-
22
-
23
-
24
-
25
-
26
-
27
-
28
-
29
-
30
-
31
-
32
-
33
-
34
-
35
-
36
-
37
-
38
-
39
-
40
-
41
-
42
-
43
-
44
-
45
-
46
-
47
-
48
-
49
-
50
-
51
-
52
-
53
-
54
-
55
-
56
-
57
-
58
-
59
-
60
-
61
-
62
-
63
-
64
-
65
-
66
-
67
-
68
 |
 |

6
NATIONAL GRID USA AND SUBSIDIARIES
CONSOLIDATED STATEMENTS OF CASH FLOWS
(in millions of dollars)
2012
2011
O perati ng acti vi tie s:
Net income
549$
495$
Adjustments to reconcile net income to net cash provided by operating activities:
Depreciation and amortization
801
813
Amortization of regulatory assets, stranded costs and rate plan deferrals
503
689
Provision for deferred income taxes
397
99
Bad debt expense
123
163
Equity loss (income) in subsidiaries, net of dividends received
15
(9)
Gain on sale of investments
(108)
(46)
Decommissioning charges
45
-
Impairment of intangible assets and property, plant and equipment
102
70
Other non-cash items
36
70
Net prepayments and other amortizations
5
(59)
Pension and other postretirement contributions
(662)
(652)
Pension and other postretirement expense
1,147
474
Net environmental payments
(89)
(115)
Changes in operating assets and liabilities:
Accounts receivable, net
434
(143)
Materials and supplies and gas in storage
(99)
92
Accounts payable and accrued expenses
(195)
(42)
Prepaid and accrued taxes
91
780
Accounts receivable from/ account s payable to affiliates, net
(112)
29
Other liabilities
(374)
64
Regulatory assets and liabilities, net
(534)
186
Other, net
(76)
65
Net cash provided by continuing operating activities
1,999
3,023
Inves ti ng acti vi ti e s:
Capital expenditures
(1,783)
(1,691)
Net proceeds from disposal of subsidiary assets
183
31
Derivative margin calls
(11)
50
Restricted cash
(8)
39
Other, including cost of removal
(137)
(153)
Net cash used in cont inuing investing activities
(1,756)
(1,724)
Fi na nci ng acti viti e s:
Common stock dividends paid to parent
-
(700)
Preferred stock dividends paid to parent
(283)
-
Payments of long-term debt
(567)
(1,694)
Proceeds from long-term debt
1,213
1,258
Commercial paper (paid) issued
(735)
735
Changes in loans from affiliates
(527)
(243)
Other
(1)
(3)
Net cash used in cont inuing financing activities
(900)
(647)
Net (decrease) increase in cash and cash equivalents from continuing operations
(657)
652
Net cashflow from discontinued operations - operating
(47)
105
Net cashflow from discontinued operations - investing
7
(30)
Cash and cash equivalents, beginning of year
1,491
764
Cash and cash equivalents, end of year
794$
1,491$
Suppl e m ental discl osure s:
Interest paid (280)$ (384)$
Income taxes paid (175) (12)
Supplemental non-cash item:
Capital-related accruals included in accounts payable 100 32
Ye ars Ended March 31,
The accompanying notes are an integral part of these consolidated financial statements.