National Grid 2012 Annual Report Download - page 48
Download and view the complete annual report
Please find page 48 of the 2012 National Grid annual report below. You can navigate through the pages in the report by either clicking on the pages listed below, or by using the keyword search tool below to find specific information within the annual report.-
 1
1 -
2
-
3
-
4
-
5
-
6
-
7
-
8
-
9
-
10
-
11
-
12
-
13
-
14
-
15
-
16
-
17
-
18
-
19
-
20
-
21
-
22
-
23
-
24
-
25
-
26
-
27
-
28
-
29
-
30
-
31
-
32
-
33
-
34
-
35
-
36
-
37
-
 38
38 -
 39
39 -
 40
40 -
 41
41 -
 42
42 -
 43
43 -
 44
44 -
 45
45 -
 46
46 -
 47
47 -
 48
48 -
 49
49 -
 50
50 -
 51
51 -
 52
52 -
 53
53 -
 54
54 -
 55
55 -
 56
56 -
 57
57 -
 58
58 -
59
-
60
-
61
-
62
-
63
-
64
-
65
-
66
-
67
-
68
 |
 |

47
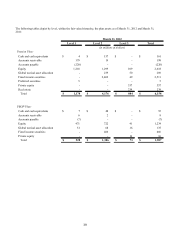
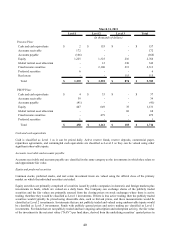
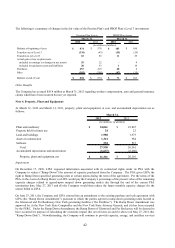
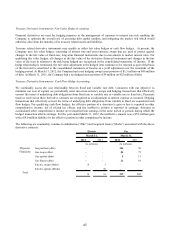
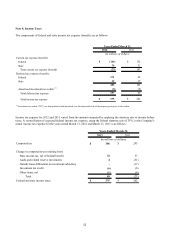
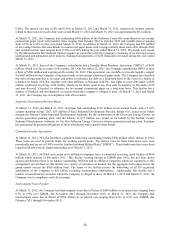
The following table presents the impact the change in the fair value of the Company’ s derivative contracts had on the
accompanying consolidated balance sheets and statements of income for the years ended March 31, 2012 and March 31,
2011:
2012 2011
Regulatory assets:
Gas swaps contracts 31$ (79)$
Gas futures contracts 17 (10)
Gas options contracts 2-
Gas purchase contracts (10) 7
Electric swaps contracts 11 (43)
Electric futures contracts -(1)
51 (126)
Regulatory liabilities:
Gas swaps contracts 16 1
Gas futures contracts -1
Gas options contracts 1-
Gas purchase contracts 4(22)
Electric swaps contracts (5) 6
Electric options contracts (101) 22
Electric purchase contracts -1
(85) 9
Total decrease in net regulatory assets 136$ (135)$
Other income (deductions):
Gas swaps contracts -$ 3$
Gas purchase contracts -1
Hedge contracts 13 (16)
13 (12)
149$ (147)$
Years Ended March 31,
(in millions of dollars)
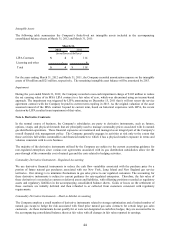
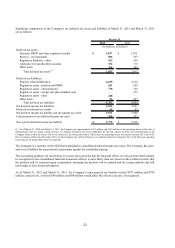
Credit and Collateral
Derivative contracts are primarily used to manage exposure to market risk arising from changes in commodity prices and
interest rates. In the event of non-performance by a counterparty to a derivative contract, the desired impact may not be
achieved. The risk of counterparty non-performance is generally considered a credit risk and is actively managed by
assessing each counterparty’ s credit profile and negotiating appropriate levels of collateral and credit support. In
instances where the counterparty’ s credit quality has declined, or credit exposure exceeds certain levels, we may limit
our credit exposure by restricting new transactions with counterparties, requiring additional collateral or credit support
and negotiating the early termination of certain agreements. Similarly, the Company may be required to post collateral
to its counterparties. As of March 31, 2012 and March 31, 2011, the Company paid $49 million and $20 million,
respectively, to its counterparties as collateral associated with outstanding derivative contracts. These amounts have
been recorded as prepaid and other current assets in the accompanying consolidated balance sheets.