National Grid 2012 Annual Report Download - page 49
Download and view the complete annual report
Please find page 49 of the 2012 National Grid annual report below. You can navigate through the pages in the report by either clicking on the pages listed below, or by using the keyword search tool below to find specific information within the annual report.
48
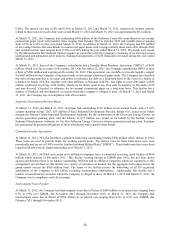
In addition, certain of the Company’ s derivative instruments contain provisions that require its debt to maintain an
investment grade credit rating from each of the major credit rating agencies. If NGUSA’ s credit rating were to fall below
a certain level, it would be in violation of these provisions, and the counterparties to the derivative instruments could
request immediate and ongoing full overnight collateralization on derivative instruments in net liability positions. The
aggregate fair value of all of the Company’ s derivative instruments with credit-risk-related contingent features that are in
a liability position on March 31, 2012 and March 31, 2011 is $108.3 million and $52 million, respectively. The
Company had posted collateral of $19.8 million and $0.3 million for these instruments at March 31, 2012 and March 31,
2011, respectively. If the Company’ s credit rating were to be downgraded by one level, it would not be required to post
any additional collateral. If the Company’ s credit rating were to be downgraded by three levels, it would be required to
post $88.4 million additional collateral to its counterparties.
Note 7. Fair Value Measurements
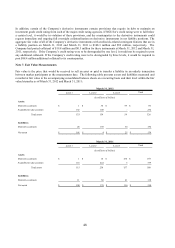
Fair value is the price that would be received to sell an asset or paid to transfer a liability in an orderly transaction
between market participants at the measurement date. The following table presents assets and liabilities measured and
recorded at fair value in the accompanying consolidated balance sheets on a recurring basis and their level within the fair
value hierarchy as of March 31, 2012 and March 31, 2011:
Level 1 Level 2 Level 3 Total
Assets:
Derivative contracts 1$ 34$ 59$ 94$
Available for sale securities 132 100 - 232
Total assets 133 134 59 326
Liabilities:
Derivative contracts 28 130 34 192
Net assets 105$ 4$ 25$ 134$
March 31, 2012
(in millions of dollars)
Level 1 Level 2 Level 3 Total
Assets:
Derivative contracts 1$ 14$ 154$ 169$
Available for sale securities 114 222 3 339
Total assets 115 236 157 508
Liabilities:
Derivative contracts 11 66 41 118
Net assets 104$ 170$ 116$ 390$
March 31, 2011
(in millions of dollars)


